CARNAC Trading - Dynamic Support and Resistance LevelsThe **CARNAC Trading - Dynamic Support and Resistance Levels** indicator is designed to help traders identify key support and resistance levels on any chart timeframe. This indicator dynamically detects major support and resistance levels based on historical price pivots and displays them as lines on the chart. The levels are color-coded for easy identification—**green lines** represent support levels below the current price, while **red lines** represent resistance levels above the current price.
Key Features:
- Dynamic Support/Resistance Detection**: Automatically identifies the strongest support and resistance levels on the chart.
- Timeframe Selection**: Allows users to choose a specific timeframe for detecting support and resistance levels, independent of the chart's timeframe.
- Pivot Strength and Lookback Period**: Customizable inputs to control how far back the indicator looks and how strong the pivots need to be for support/resistance detection.
- Level Limitation**: Limits the number of support and resistance lines to keep charts clean, ensuring only the most relevant levels are displayed.
---
How to Use the Indicator:
Inputs and Settings:
1. **Lookback Period**: Defines how many bars back the indicator will consider for detecting support and resistance levels. You can adjust this depending on how much historical data you want to include. A larger value will capture more significant levels, while a smaller value focuses on more recent price action.
2. **Pivot Strength**: This setting determines how significant a high or low must be to qualify as a pivot. A higher pivot strength will capture stronger, more critical levels, while a lower value will detect more frequent, minor pivots.
3. **Max Levels Above/Below Price**: This controls the maximum number of support and resistance levels displayed on each side of the current price. Keeping this number low helps reduce clutter and focuses on the most important levels.
4. **Timeframe for Support/Resistance Detection**: Select the timeframe used for detecting support and resistance levels, which can differ from the chart's timeframe. This is helpful when you're trading on shorter timeframes but want to see key levels from a higher timeframe (e.g., detecting daily levels while trading intraday).
---
Visualization:
- **Green Lines**: Represent support levels below the current price. These are potential areas where buying interest may increase, and the price could bounce upwards.
- **Red Lines**: Represent resistance levels above the current price. These are potential areas where selling interest may increase, and the price could fall downwards.
---
Example Usage:
1. **Identifying Support and Resistance Zones**: Use this indicator to identify critical support and resistance zones. These are areas where the price has historically reversed or paused, making them ideal for setting entry, exit, stop-loss, or take-profit levels.
2. **Trend Analysis**: By observing which side of the current price the majority of lines are on (more red or more green), traders can gauge whether the market is facing more resistance or support, helping them align with the current trend.
3. **Timeframe Flexibility**: You can choose to detect support and resistance levels from higher timeframes (e.g., Daily or Weekly) while trading on lower timeframes (e.g., 15-minute or 1-hour charts). This gives you a macro-level view of key price levels while executing trades on the micro-level.
---
Recommendations:
- **Swing Traders**: Use this indicator with a larger lookback period and higher pivot strength to capture major long-term support and resistance levels.
- **Scalpers and Intraday Traders**: Use shorter lookback periods and lower pivot strengths to detect key levels within a shorter timeframe.
By customizing the inputs and tailoring them to your trading style, this indicator can provide valuable insights into price levels where significant buying or selling activity is likely to occur, helping you make more informed trading decisions.
Recherche dans les scripts pour "support resistance"
CARNAC Trading Support and Resistance LevelsOverview
The "Carnac Trading Support and Resistance Levels" indicator is a powerful tool designed to help traders identify key support and resistance levels across multiple timeframes. This tool enhances trading strategies by visually marking significant price levels and providing configurable stop-loss and alert features.
Features
Support and Resistance Levels: Automatically calculates and plots support and resistance levels for the following timeframes:
5 minutes (5M)
10 minutes (10M)
15 minutes (15M)
30 minutes (30M)
1 hour (1H)
2 hours (2H)
4 hours (4H)
6 hours (6H)
12 hours (12H)
1 day (1D)
1 week (1W)
1 month (1M)
Configurable Stop-Loss (SL) Levels: Adds a stop-loss line below each support level and above each resistance level with customizable padding (as a percentage).
Visual Labels: Clearly labels support, resistance, and stop-loss levels with the corresponding prices and timeframes for easy identification.
Line Customization:
Support Levels: Green lines with varying thickness based on the timeframe.
Resistance Levels: Red lines with varying thickness based on the timeframe.
Stop-Loss Levels: Gray dotted lines for clear distinction.
Alerts: Alerts trigger when the price gets to a configurable percentage from the support or resistance levels, helping you stay informed about potential buying and selling opportunities.
Visibility Toggling: Easily toggle the visibility of support and resistance levels for each timeframe (default enabled for 2H, 4H, and 1D).
How to Use
Add the Indicator:
Navigate to the TradingView Pine Editor.
Paste the provided Pine Script code and click "Add to Chart."
Configure Inputs:
Lookback Periods: Adjust the lookback periods for each timeframe to suit your analysis needs.
Padding Percentage: Set the padding percentage for the stop-loss levels to define the distance below the support levels and above the resistance levels.
Visibility: Toggle the visibility of the support and resistance levels for each timeframe as needed (default enabled for 2H, 4H, and 1D).
Alert Trigger Distance: Set the alert trigger distance as a percentage to determine when the alerts should be triggered.
Interpret the Plotted Levels:
Green Lines: Indicate support levels for the respective timeframes.
Red Lines: Indicate resistance levels for the respective timeframes.
Gray Dotted Lines: Represent the stop-loss levels below each support level and above each resistance level, with the specified padding.
Labels: Provide clear indications of the price levels and their respective timeframes in white text for visibility.
Identifying Buying and Selling Opportunities:
Buying Opportunities:
Look for the price to approach or bounce off a support level (green line).
Confirm the potential for a reversal by checking if the price is nearing a key support level from multiple timeframes.
Use the stop-loss level (gray dotted line) to set your stop-loss order below the support level to minimize risk.
Selling Opportunities:
Look for the price to approach or get rejected at a resistance level (red line).
Confirm the potential for a reversal by checking if the price is nearing a key resistance level from multiple timeframes.
Use the stop-loss level (gray dotted line) to set your stop-loss order above the resistance level to minimize risk.
Alerts:
Alerts will notify you when the price gets within the specified percentage distance from each support or resistance level.
Use these alerts to stay informed about potential buying and selling opportunities.

Ichimoku Cloud w/ HelpersIchimoku Cloud w/ Helpers is your standard Ichimoku Cloud indicator with two additions.
Checkout TradingView's write up on the Ichimoku Cloud here .
The two additions added to this indicator are described below:
1 — A box is drawn centered on the current bar and stretching a length equal to the 'Senkou Span B Period'.
• The box encompasses the highest high and lowest low in that period.
2 — Two new lines are added.
• Green Line : Projection from the Lagging Line (Chikou Span) to the Span A line, indicating historical price action relative to future projected support/resistance.
• Red Line : Projection from the Kijun-sen (Base Line) to the Span B line, indicating medium-term trend direction relative to future projected support/resistance.
Use cases :
• The Box is simply a visual cue to draw your eye towards the area that the Ichimoku Cloud is currently attempting to analyze: Past, Present and Future.
• The green and red lines add a way to interpret the sentiment:
• Diverging Lines with Green Above Red --> Interpret as Bullish Sentiment
• Converging Lines with Green Crossing Above Red --> Interpret as Bullish reversal or strengthening
• Converging Lines with Green Crossing Below Red --> Interpret as Bearish reversal or weakening.
• Diverging Lines with Red Above Green --> Interpret as Bearish Sentiment
• Converging Lines with Red Crossing Below Green --> Interpret as Bullish reversal or weakening bearish trend.
Current limitations :
• Under settings -> Styles, the plotted lines don't allow the colors to be changed. A bug I'm trying to figure out.
Bugs?
Kindly report any issues you run into and I'll try to fix them promptly.
Thank you!

Weighted Moving Range with Trend Signals (WMR-TS)Weighted Moving Range with Trend Signals (WMR-TS)
Technical analysis involves analyzing statistical trends from trading activity , such as price movement and volume, to make trading decisions. Technical indicators are mathematical calculations based on the price, volume, or open interest of a security or contract. They are used by traders to analyze price movements and predict future market behavior. The WMR-TS indicator combines weighted moving averages and range calculations to identify key trading levels and generate buy/sell signals. It dynamically adjusts to market conditions, offering traders insights into potential support, resistance, and trend reversal points. Key levels are color-coded for quick interpretation. It utilizes weighted moving averages (WMA) and range calculations to determine these levels, making it a robust tool for both trending and ranging markets.
SUMMARY
Parameters :
WMA Length : Determines the length for the primary weighted moving average.
Highest High Length : Sets the period for calculating the highest high.
Lowest Low Length : Sets the period for calculating the lowest low.
Range Corrector : Adjusts the range calculation slightly for fine-tuning.
Top Level : Multiplier for determining the top level from the calculated range.
Bottom Level : Multiplier for determining the bottom level from the calculated range.
Levels Visibility : Sets how many recent bars will display the levels.
Trading Zones :
Short Area : Highlighted zone indicating potential shorting opportunities.
Long Area : Highlighted zone indicating potential buying opportunities.
The Levels :
Wave (Yellow): Midpoint of the calculated range, adjusted by WMA.
Top Level (Red): Calculated upper boundary of the trading range.
Sell Level (Pink): Intermediate sell level.
Resistance Level (Magenta): Immediate resistance level.
Support Level (Cyan): Immediate support level.
Buy Level (Light Green): Intermediate buy level.
Bottom Level (Dark Green): Calculated lower boundary of the trading range.
Interpreting the Signals :
Hammer Signal : Red circles above bars indicate potential sell signals.
Rocket Signal : Green circles below bars indicate potential buy signals.
KEY CONCEPTS
Highest High and Lowest Low :
These values represent the highest high ( HH ) and lowest low ( LL ) over a specified number of periods.
Support Level :
This is the lower boundary of the trading range. It is a price level where demand is strong enough to prevent the price from falling further. As the price approaches the support level, it is likely to bounce back up.
Resistance Level :
This is the upper boundary of the trading range. It is a price level where supply is strong enough to prevent the price from rising further. As the price approaches the resistance level, it is likely to pull back down.
THE USE OF MULTIPLIERS :
The script uses several multipliers to adjust and fine-tune the calculated support and resistance levels, as well as to control the range and sensitivity of these levels. Here is a detailed explanation of these multipliers and their purpose:
Range Corrector : This multiplier adjusts the calculated high ( H ) and low ( L ) levels, adding flexibility to how these levels are positioned relative to the highest high and lowest low. It ranges from -1 to 1 , with a default value of 0 . The use of positive values increase the range, making the calculated levels further apart. Thus, using negative values decrease the range, bringing the calculated levels closer together.
Top Level : This multiplier adjusts the distance of the top level from the calculated high H ) level. It fluctuates from 0 to 2 , with a default value of 0.382 . Higher values will push the top level further above the high level, while lower values will bring it closer.
Bottom Level : This multiplier adjusts the distance of the bottom support level from the calculated low support level. Ranging from 0 to 2, with a default value of 0.214, the higher values will push the bottom level further below the low level, while lower values will bring it closer.
The script plots the support and resistance levels on the chart, allowing traders to visualize the trading range. Color-coded zones are used to indicate areas where buying or selling opportunities may arise based on the current price relative to the trading range. A trading range refers to the area between a price's support and resistance levels over a specific period of time. Within this range, the price of the security fluctuates up and down but does not break out above the resistance or below the support. Support and resistance levels to make trading decisions. Buying near the support level and selling near the resistance level is a common strategy. When the price moves above the resistance level, it is called a breakout . A breakout often indicates that the price may start a new upward trend . Conversely, when the price moves below the support level, it is called a breakdown . A breakdown often indicates that the price may start a new downward trend . By understanding and utilizing trading ranges, traders can make more informed decisions, optimize their trading strategies, and manage risk more effectively.
Understanding Moving Averages
A moving average (MA) is a widely used technical indicator that helps smooth out price data by creating a constantly updated average price. The main purpose of using a moving average is to identify the direction of the trend and to reduce the "noise" of random price fluctuations. The Weighted Moving Average ( WMA ) assigns different weights to each period, with more recent periods typically given more weight. A 10-day WMA might give the most recent day a weight of 10, the second most recent day a weight of 9, and so on. It is useful for traders who want to emphasize recent price data more than older data. When the price is above the moving average, it suggests an Bullish trend . A Bearish Trend is expected to take place when the price is below the moving average. Understanding the price reactions around these levels can be used to make trading decisions.
APPLYING CONCEPTS
Support and Resistance Calculations in the Script :
The script calculates dynamic support and resistance levels using weighted moving averages ( WMA s) and the highest high and lowest low over specified periods. Buy ( Rocket ) and sell ( Hammer ) signals are generated based on the crossing of the price with calculated top and bottom levels.These signals help traders identify potential entry and exit points within the trading range .
Weighted Moving Average (WMA) Application in the Script
This script calculates a special trendWMA using the close price that helps in creating a more dynamic moving average that considers both high and low price actions. This modified WMA is used in conjunction with highest high and lowest low values over specified periods to calculate dynamic support and resistance levels.
Explanation of the Levels in the Script
By understanding these levels, traders can make more informed decisions about where to enter and exit trades, manage risk, and anticipate potential market movements. The script incorporates several key levels levels that traders can use to better anticipate price movements and make more informed trading decisions. Leveraging the principles of Fibonacci retracement ratios ( 23.6%, 38.2%, 50%, 61.8%, and 100% ) to identify key support and resistance zones can also serve for gauging the overall market sentiment.
Top Level and Sell Leve l: Used to identify potential resistance zones where the price may reverse or pause.
Support Level and Buy Level : Used to identify potential support zones where the price may bounce.
Upper and Lower Pivot Values : Serve as intermediate levels for possible price retracements or extensions within the trading range.
Wave Level : Indicates the central trend direction, which can be useful for gauging the overall market sentiment.
Alerts are a crucial part of the script as they notify traders of potential buy and sell signals based on predefined conditions. There are two main alerts: one for a " Hammer " signal (sell condition) and one for a " Rocket " signal (buy condition).
Adjust the input parameters to fit your trading style and the specific asset being analyzed. Shorter lengths may be more responsive to price changes but can produce more false signals , while longer lengths provide smoother signals but may lag . Always backtest the indicator on historical data to understand its behavior and performance. Also remember that different markets may require different parameter settings for optimal performance.
Keep in mind that by nature like all moving averages, WMAs lag behind price action. This means that signals may be delayed. The indicator performs differently in various market conditions. Always consider the overall market context when interpreting signals.
Adjusting parameters like the range corrector and visibility can help tailor the indicator to specific market conditions or trading strategies, improving its effectiveness. The script uses the calculated levels to plot lines and fill zones on the chart, helping traders visualize potential support, resistance, and trend reversal points. The use of multipliers allows for dynamic adjustment of these levels, making the indicator flexible and adaptable to different market conditions.
I think traders can make more informed decisions about where to enter and exit trades, manage risk, and anticipate potential market movements following this code. Stay safe and always remember that market is always changing. Use this tool if you want, please stay informed and plan safe trades,
D.

EMA + ATR Support and Resistance + Take Profit SignalThe 'EMA+ ATR Support Resistance Take Profit signal' indicator is a technical analysis tool designed to help traders identify potential support and resistance levels, using the Exponential Moving Average (EMA) and the Average True Range (ATR) indicators. This indicator not only tracks the EMA and ATR but also plots these levels as support and resistance lines, providing useful insights into potential buy and sell points.
The indicator allows you to set the lengths for both the EMA and ATR, with default values set to 20 and 14, respectively. Moreover, you can specify the multiplier for the ATR in the Support/Resistance (S/R) length setting, which defaults to 2. The line width for the plotted lines can also be adjusted according to your preference.
The EMA line in center is invisible by default but you can change that by going to the setting of the indicator. The support and resistance lines are plotted in green and red, respectively. When the price hits the support or resistance levels, the indicator provides a visual signal with a cross shape below or above the respective bars, in lime and red, respectively. If you do not need the take profit signals you can disable them in the setting.
How to Use:
1. Define the EMA and ATR lengths according to your trading strategy. Higher lengths will provide smoother lines but may also lag the current price action.
2. Set the S/R length to determine the distance of the support and resistance lines from the EMA line. Higher values will place these lines further away from the EMA.
3. Monitor the chart for instances when the price hits the support or resistance levels. This is indicated by a cross shape below (for support hit) or above (for resistance hit) the price bar. These points may be considered as potential take profit points or entry/exit points, depending on your strategy.
4. Use the indicator in conjunction with other tools and indicators to confirm signals and reduce the risk of false signals. So the assumption is you enter a trade using your other indicators but you can rely on this indicator to remind you to take profit if you are long by a red cross of the resistance line and if you are short reminds you by a green cross on the support line.
Disclaimer: This indicator should not be used as the sole determinant for any investment decision. Always conduct thorough research and consider multiple factors before trading.

Trend/Retracement - ZigZag - New wayZigZag for Trend and Retracements - New way
It's another way to plot ZigZag based on lookback period for trend and % of trend lookback period to plot retracements.
█ OVERVIEW
Plot ZigZag, Trend lines, Retracements, Support levels, Resistance levels
█ Objective:
Draw ZigZag lines along with unbroken support and resistance levels. ZigZag lines are drawn for main trend and the retracements.
Main Trend – This is calculated based on lookback period.
Retracements – Retracements are calculated as 25% of main trend.
Support and Resistance line: The indicator draws 2 types of support and resistance lines
1. Un-broken – Once formed (plotted), these are the support and resistance which are not yet broken
2. Tested – One can also choose to see support and resistance lines which are tested but not broken. Tested support/resistance are those levels which are touched by high/low price but close price has not crossed the level.
█ How main trend point is calculated:
E.g.
Chart timeframe = 15m
Lookback period = 250
Retracement = 25% of main trend ( 25% of 250 = 62 )
A price point on a chart is considered as trend point if distance between current price and previous highest price is 250 candles
A price point is considered as a retracement if distance between current price and previous highest price is 62 candles. Please note retracements are calculated only after finding a main trend point.
█ Input parameters:
Zigzag Parameters
Use predefined Lookback – If checked pre-defined timeframe-based lookback parameters are used.
Trend lookback candles – If ‘Use predefined Lookback’ is unchecked then this value is used as lookback period.
Retracement % of look back candles– If ‘Use predefined Lookback’ is unchecked then this value is used for calculating retracement lookback period
Mark retracements – If unchecked only main trend lines are plotted
Plot support/resistance – To plot support/resistance levels
Show support/resistance tested lines – If checked tested support/resistance liens are shown on the chart
█ TF based Lookback period config (Defaults are set as specified below, One can change these defaults to use different lookback periods)
The defaults set here are used based on the chart timeframe. e.g. if chart timeframe is changed from say 15m to 60m then 60m chart defaults (i.e. trend lookback = 90) are used to plot the trend and the retracements. At the bottom-right of the chart, parameters used for plotting are displayed all the time.
Timeframe in minute – Default = 5m
Trend lookback candles – Default = 375 (~ 5 days of data)
Timeframe in minute – Default = 15m
Trend lookback candles – Default = 250 (~10 days of data)
Timeframe in minute – Default = 60m
Trend lookback candles = Default = 90 (~ 15 days of data)
Trend lookback candles for timeframe 'D' – Default = 30 (~1 month data)
Trend lookback candles for timeframe 'W' – Default = 21 (~6 months data)
Trend lookback candles for timeframe 'M' – Default = 12 (~1year data)
Retracement % of look back candles – Default = 25%
█ When and where one can use this indicator (Refer to chart examples)
To view support and resistance based on lookback period
To view ZigZag lines
One can use it to find chart patterns easily
Trend and retracement lines can help in drawing Elliott waves.
█ Chart examples:
1. Chart patterns can be easily identified - One can disable the candle charts which will help to identify and draw chart patterns easily
2. Trend and retracement lines can also help is analyzing charts (e.g. Elliott Waves can be marked based on trend lines)
3. Tested but not broken support and resistance lines can be viewed
4. You can select 'NOT' to plot tested support and resistance lines
5. Uncheck the Mark retracements to plot main trend lines (Retracements are not marked)

Price Action in action
What?
Price Action in Action is an indicator to help Price Action learners and practitioners to get everything related for Price Action in one place.
Price Action is:
Price + Volume = Action
In this indicator, we have the following features available:
Support/Resistance
Using the RSI with different periods in a multiple of 7 (7, 14, 21, 28), we first determine the overbought (above 70, customizable) and oversold (below 30, customizable) regions. Then we pick up the highest point and lowest point in the RSI values in the overbought and oversold regions, respectively. These are the point, historically supply/demand emerged for surety to push down/up the RSI indicator and the corresponding price. So, these are the most accurate way, we believe, to draw support/resistance (or demand/supply) in the chart. By default, the Support is green color and Resistance is red color. To give a visual representation, we differentiate the different shades of green and red. For example, for Level-1 (i.e. 7 by default) we use the darkest shade (0 transparency) and Level-4 (i.e. 28 by default) we use lighter shade (60 transparency). Note please: you can customize the color of support and resistance lines (say if you want resistance as green and support as red). The respective shades (transparency) will be automatically adjusted accordingly. But those shade (transparency) levels are not customizable, they are fixed (please bear with it for version-1 at least).
Strength of Support/Resistance
In the chart above/below the Resistance / Support lines you can see the tiny labels with some numbers like 1, 2.
We found out how many times a particular support/resistance is appearing across multiple RSI periods. E.g. if price P1 appears 2 times among 4 different RSI periods, the number will be 2 for that calculation, and so on.
There can be multiple presence of these numbers in a support/resistance line (i.e. multiple tiny labels). Something like: 1, 1, 2 (into different candles). This means the same support/resistance is tested so many times in different occasion (means there is a RSI max/min coincides in this level over multiple occasions) at different candles.
This will help you to intuitionally gauge the “strength” of a support/resistance line.
The more the marrier, unworthy to mention.
Candle Stick Patterns
Well: we don’t need to tell anything about the Candlestick. All of you know it better than us. And it’s a time proven, zero-lag mechanism to judge the Price-Action is unfolding in the market. We do not know if there is anything better possible than this time tested patterns to judge the prevailing sentiments of market.
Price-Action does not complete without finding out the Candlestick Patterns correctly.
And in this indicator your will get all of these: Single Candle such as Doji (default off), Marubozu, Spinner, hammers, inverted-hammer etc. ; 2 candles like Tweezer, Inside Candle, Engulfing; 3 candles like morning star/evening star.
In the multi candle patterns (2/3 candles), we are grouping the candles with a dotted rectangle such that it is clear which 2/3 candles are part of the pattern. E.g. Morning Star: 3 candles are grouped in a dotted rectangle and the Morning Star label will come to the latest candle (3rd most – as the pattern is detected reliably only on the completion of the 3rd final candle).
Of course, any program can not eliminate your trained eyes and brain to capture the patterns. But we have provided sufficient knobs to adjust various parameters to tweak the candle-pattern detection. Such as Strict Inside Candle(Harami) Boolean knob where the whole current candle including wicks will be inside the body part of the previous big candle. For non-strict mode, the current candle just inside the previous candle, possibly by wicks.
To make it better usable, for every such knobs (which are not obvious) we have added user-friendly tooltip (just mouse hover the question mark (?) besides the control/switch). There are plenty of it.
Volume
Here we have a rudimentary (yet effective) way to judge the volumes.
We find out the Volume Weighted Moving Average (VMWA) of the 20-period (default, but customizable) and the latest volume. If the latest volume is more than the 20 period vwma, we just add a grey diamond on the top of the candle to denote it’s attracting volumes. Of course, we provide a Weight coefficient (default is set to 1). So if the current bar’s volume on bar’s completion is more than the 20 period volume vmwa times the weigh-cofficient, we mark it with a tiny grey diamond.
Points to be noted:
In all places we mark the indication only on the completion of the bar (technically speaking we have checks, as far as possible, with barstate.isconfirmed). However, if you wish, you can turn it off for Candlestick (as some experts may want to check candlestick on the real time, even before the closing of bars).
In case if you see the chart looks cluttered (because of many information, specially in smaller timeframes like 5 min), there are controls given in the settings to toggle each and every features.
By default, we turn off Doji candles (all 3 types of Doji’s – normal, Gravestone & Dragonfly) as they are mainly indecision. However, you can toggle it to turn it on.
It does not give you any Buy/Sell call. The interpretation it does not have.
Why?
What’s unique in it?
As we already mentioned our intention is to include Price (in forms of Support / Resistance), Volume and Action (sentiments in terms of Candlestick patterns) into a single place. And so far, to the best of our knowledge, we could not come across a single indicator provides all of these.
There were works available to determine the RSI based support / resistance zones. Those are great piece works at that time (lets say 3 years back when PineScript was in earlier versions). To the best of our knowledge those does not cover up finding out the lowest / highest point of RSI and the corresponding price to get the simplistic and distinct support/resistance lines.
We have the intuitive support/resistance strength included which we could not found out in current set of available indicators.
To the best of our knowledge, there seems no indicator can detect 3-candle patterns which are extremely popular to detect trend reversals (such as Morning Star or Evening Star). Moreover for the multi-candle patterns we are grouping the candles part of the pattens (2-candles or 3-candles) using a dotted rectangle such that it’s visually clearly (and a well educative material for Price-Action learners also).
Mentions:
There are many works which inspire us along the way. Honestly: we sometimes forgot which all indicators we experimented with. We are sincerely apologetic in case we forgot to mention. A few note-worthy:
There is an indicator from user “repo32” named as “Candlestick Patterns Identified (updated 3/11/15)”. (We could not be able to contact “repo32”). We are inspired from his work that it’s feasible to detect Candlestick patterns.
There is an awesome work done by “RSI Based Automatic Demand and Supply” by user “shtcoinr”. The idea of consulting multiple RSI levels to find out the demand/supply zone we inspired from him. (We did contact “shtcoinr” and got his kind permission to use the concept.)
We are greatly thankful to these abovementioned wizards for their pioneering a-prior work in this front.
And of course, this TradingView platform to provide this abstraction, facilitates and felicitates collaborative contributions.
Ultimately, what’s for you?
That’s the main question. What’s for you?
Price-action comprises of following 3 tasks (at least):
Draw support/resistance lines in the chart.
Once price reaches at the support/resistance line, you fervently look out the candles’ formation to mentally map to the candle patterns. Your aim is divine: You want to judge if the price-action will continue or take a rejection/reversal.
Then you double-confirm with the volume (in a non-overlaid chart below).
Finally take a trade.
For a price-action newbie or seasoned, expert practitioner, you must be doing all the above tasks regularly and manually, in a mechanical, mundane way. There come the humanly subjectivity & the inevitable emotions . This indicator, being a piece of program/code in PineScript latest version v5 , eliminates (or at least, reduces to a great extend) that subjectivity & emotions out of the way of decision making . Thus resulting better yield.
Of course, you can argue that you draw slanted trend lines also. We recommend an already existing indicator by user LuxAlgo named as “Trendlines with Breaks ”, if you wish so.
Disclaimer:
This piece of software does not come up with any warrantee or any rights of not changing it over the future course of time.
We are not responsible for any trading/investment decision you are taking out of the outcome of this indicator.
Happy trading.

Fibonacci Grid [LuxAlgo]The following indicator returns multiple diagonal lines forming a grid. Each line has 45-degree and is set depending on Fibonacci ratios as well as the maximum and minimum price value over a certain lookback period. These can be used as potential support and resistance.
Users also have the option to set equidistant lines instead of having them determined by Fibonacci ratios.
Settings
Length: Lookback period for determining the maximum/minimum price value used for constructing the grid.
Resolution: Grid resolution, higher values will return more lines (only available when the "Use Fibonacci Ratios" is disabled)
Use Fibonacci Ratios: Set the lines based on Fibonacci Ratios, 6 ratios are used.
Usage
Each individual diagonal line can be used as support/resistance. Two Diagonal lines form channels where the price might evolve until a breakout.
The underlying logic of this grid determined by Fibonacci ratios is that price variations farther away from the main diagonals (in orange) would tend to move inside tighter channels.
Diagonals set using Fibonacci Ratios will form tighter channels when away from the center of the Lookback area. While equidistant lines will keep the same distance between each line.

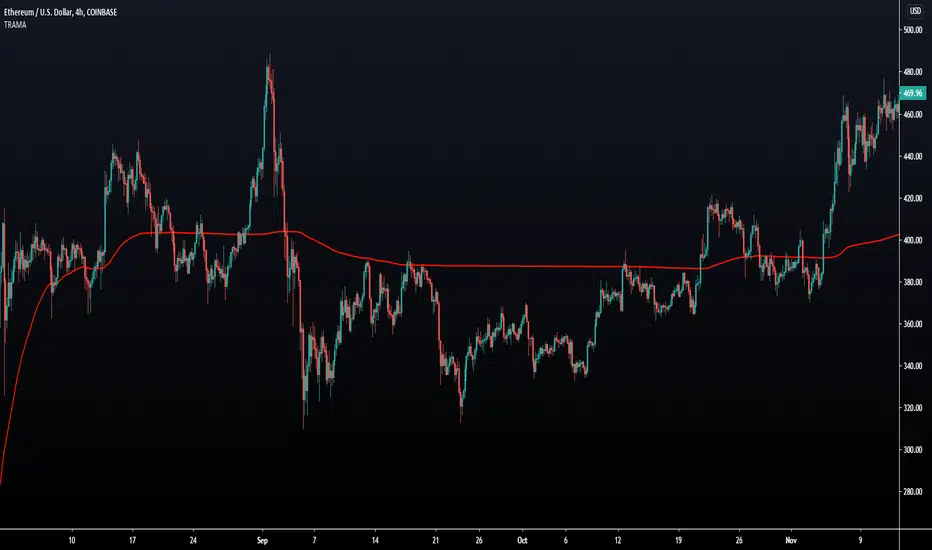
Trend Regularity Adaptive Moving Average [LuxAlgo]The following moving average adapt to the average number of highest high/lowest low made over a specific period, thus adapting to trend strength. Interesting results can be obtained when using the moving average in a MA crossover system or as a trailing support/resistance.
Settings
Length : Period of the indicator, with higher values returning smoother results.
Src : Source input of the indicator.
Usage
The trend regularity adaptive moving average (TRAMA) can be used like most moving averages, with the advantage of being smoother during ranging markets.
Notice how the moving closer to the price the longer a trend last, such effect can be practical to have early entry points when using the moving average in a MA crossover system, such effect is due to the increasing number of average highest high/lowest low made during longer trends. Note that in the case of a significant uptrend followed by a downtrend, the moving average might penalize the start of the downtrend (and vice versa).
The moving average can also act as an interesting trailing support/resistance.
Details
The moving average is calculated using exponential averaging, using as smoothing factor the squared simple moving average of the number of highest high/lowest low previously made, highest high/lowest low are calculated using rolling maximums/minimums.
Using higher values of length will return fewer highest high/lowest low which explains why the moving average is smoother for higher length values. Squaring allows the moving average to penalize lower values, thus appearing more stationary during ranging markets, it also allows to have some consistency regarding the length setting.
🧙 this moving average would not be possible without the existence of corn syrup 🦎
CME Gap Tracker [captainua]CME Gap Tracker - Advanced Gap Detection & Tracking System
Overview
This indicator provides comprehensive gap detection and tracking capabilities for both consecutive bar gaps and weekly CME trading session gaps. It automatically detects gaps, tracks their fill progress in real-time, provides detailed statistics, and includes backtesting features to validate gap trading strategies. The script is optimized for CME futures trading but works with any instrument, automatically handling ticker conversion between CME futures and spot markets.
Gap Detection Types
Consecutive Bar Gaps:
Detects gaps between any two consecutive bars on the current timeframe. Two detection modes are available:
- High/Low Mode: Detects gaps when current bar's low > previous bar's high (gap up) or current bar's high < previous bar's low (gap down). This is more sensitive and detects more gaps.
- Close/Open Mode: Detects gaps when current bar's open > previous bar's close (gap up) or current bar's open < previous bar's close (gap down). This is more conservative.
Weekly CME Gaps:
Detects gaps between weekly trading sessions, specifically designed for CME futures markets. The script automatically detects the first bar of each new week and compares the current week's open with the previous week's close/high/low. This is particularly useful for tracking weekend gaps in CME futures markets where price can gap significantly between Friday close and Monday open.
Smart Ticker Detection
The script automatically converts between CME futures tickers (e.g., BTC1!, ETH1!) and spot tickers (e.g., BTCUSDT, ETHUSDT). When viewing a CME futures chart, it can automatically detect and use the corresponding spot ticker for gap analysis, and vice versa. This allows traders to:
- View CME futures but track spot market gaps
- View spot markets but track CME futures gaps
- Manually override with custom ticker specification
The ticker validation system uses caching to prevent race conditions during initial script load, ensuring reliable ticker resolution.
Gap Filtering & Tolerance
Static Tolerance:
Set minimum and maximum gap sizes as percentages (default: show only gaps > 0.333% and < 100%). This filters out noise and focuses on significant gaps.
Dynamic Tolerance:
When enabled, tolerance is calculated dynamically based on ATR (Average True Range). The formula: Dynamic Tolerance = (ATR × ATR Multiplier / Close Price) × 100%. This adapts to market volatility - in volatile markets, only larger gaps are shown; in calm markets, smaller gaps are displayed. This is particularly useful for instruments with varying volatility.
Absolute Size Filtering:
In addition to percentage filtering, gaps can be filtered by absolute price size (e.g., show only gaps > $100). This is useful for instruments where percentage alone doesn't capture significance (e.g., high-priced stocks).
Fill Confirmation System
To reduce false gap closure signals, the script requires multiple consecutive bars to confirm gap closure. The default is 2 bars, but can be adjusted from 1-10 bars. Lower values (1) confirm faster but may produce false signals from temporary wicks. Higher values (3-5) reduce false fill signals but delay confirmation. This prevents temporary price spikes from triggering false gap closure alerts.
Gap Fill Tracking
The script tracks gap fill progress in real-time:
- Fill Percentage: How much of the gap has been filled (0-100%)
- Fill Speed: Whether fill is accelerating, decelerating, or constant
- Time to Fill: For closed gaps, how many bars it took to fill
- Fill Status: Unfilled, partially filled, or fully filled
Visual Features
Heatmap Colors:
Gap colors can be adjusted based on gap size, with larger gaps appearing more intense and smaller gaps more faded.
Adaptive Line Width:
Line thickness automatically adjusts based on gap size, making larger gaps more prominent.
Age-Based Coloring:
Gaps can be color-coded by age, with newer gaps appearing brighter and older gaps more faded.
Confluence Zones:
Areas where multiple gaps overlap are highlighted with enhanced visuals, indicating stronger support/resistance zones.
Gap Statistics
A comprehensive statistics table provides:
- Total gaps created, open, and closed
- Fill rates by direction (up vs down) and size category (small, medium, large)
- Average fill time, fastest fill, slowest fill
- Oldest gap and oldest unfilled gap
- Backtesting results: success rate, reversal rate, average move after fill
- CME gap expiration statistics: Gaps expired unfilled (for Weekly CME gaps only)
Statistics can be filtered by period (All Time, Last 100/500/1000/5000 bars) and can be reset via toggle button.
Backtesting
When enabled, the script tracks price movement after gap fills:
- Price after fill: Captures price when gap closes
- Move after fill: Percentage price movement after closure
- Success/Reversal tracking: Determines if price continued in fill direction or reversed
- Success rate: Percentage of gaps where price continued in fill direction
This data helps validate gap trading strategies and understand gap fill behavior.
Gap Re-opening Detection
When enabled, the script detects when a previously filled gap reopens (price gaps back through the filled gap zone). This is useful for identifying when support/resistance levels break and can signal trend reversals.
CME-Specific Features
Monday Opening Volume Analysis:
For Weekly CME gaps detected on Monday openings, the script tracks Monday opening volume relative to average volume. Higher Monday volume ratios indicate stronger gap significance. This ratio is integrated into gap strength calculations and can be displayed in gap labels. Gaps with Monday volume > 1.5x average receive priority score boosts.
CME Gap Expiration Tracking:
Weekly CME gaps that remain unfilled beyond a configurable threshold (default 1000 bars) are automatically marked as "expired" and tracked separately in statistics. This helps identify gaps that act as strong support/resistance levels and never fill. Expired gaps are displayed with special labeling and counted in the "Gaps Expired (CME)" statistic.
CME Gap Priority Scoring Enhancement:
The priority scoring system includes special boosts for CME gaps:
- Monday gaps: +10 points (gaps detected on Monday openings)
- High Monday volume gaps: +15 points (Monday volume ratio > 1.5x average)
- Gaps at key weekly levels: +10 points (gaps aligning with previous week's high, low, or close within 0.5% tolerance)
These enhancements help prioritize the most significant CME gaps for trading decisions.
Custom Gap Zones
Traders can manually mark custom gap zones by specifying top and bottom levels. These zones are tracked like automatically detected gaps, allowing traders to:
- Mark historical gaps that weren't detected
- Create support/resistance zones based on other analysis
- Track specific price levels of interest
Multi-Timeframe Support
The script can detect gaps on higher timeframes simultaneously. For example, when viewing a 1-hour chart, it can also detect and display gaps from the weekly timeframe. This provides multi-timeframe context for gap analysis.
Alert System
Comprehensive alert system with multiple trigger types:
- Gap Creation: Alert when new gaps are detected
- Gap Closure: Alert when gaps are fully filled
- Partial Fill: Alert when gaps reach specific fill percentages (e.g., 25%, 50%, 75%, 90%)
- Approaching Closure: Alert when gaps reach high fill levels (e.g., 90%, 95%) before closing
- Gap Re-opening: Alert when previously filled gaps reopen
Alerts can be filtered to trigger only on Mondays (useful for CME weekly gaps) or any day.
Filtering Options
Gaps can be filtered by:
- Fill Status: Show all, unfilled only, partially filled only, or fully filled only
- Fill Percentage Range: Show gaps within specific fill percentage ranges
- Gap Age: Show only gaps within specific age ranges (bars)
- Gap Expiration: Automatically remove gaps older than specified number of bars (for Weekly CME gaps, uses separate CME expiration threshold)
Performance & Safety
The script includes several safety features:
- Safe array operations to prevent index out-of-bounds errors
- Memory leak prevention through proper visual object cleanup
- Ticker validation caching to prevent race conditions
- Week boundary detection for accurate CME gap identification
- Fill confirmation system to reduce false signals
- Monday opening volume analysis for CME gap strength assessment
- CME gap expiration tracking with configurable thresholds
- Priority scoring enhancement for Monday gaps, high Monday volume, and key weekly levels
Usage Recommendations
For CME Weekly Gaps:
1. Set "Gap Detection Type" to "Weekly CME"
2. View a CME futures chart (e.g., BTC1!) or enable auto-detect spot ticker
3. Set tolerance to filter gap size (default 0.333%)
4. Enable statistics to track fill rates
5. Configure alerts for gap creation/closure
For Consecutive Bar Gaps:
1. Set "Gap Detection Type" to "Consecutive Bars"
2. Choose "High/Low" for more gaps or "Close/Open" for fewer gaps
3. Adjust tolerance based on instrument volatility
4. Enable fill confirmation (2-3 bars) for more reliable signals
5. Use filtering to focus on specific gap types
For Gap Trading Strategies:
1. Enable backtesting to validate strategy performance
2. Review statistics to understand gap fill patterns
3. Use confluence zones to identify strong support/resistance
4. Configure alerts for gap events matching your strategy
5. Use custom zones to mark important levels
Technical Details:
• Pine Script v6 | Overlay indicator
• Safe array operations with index validation
• Memory leak prevention through proper object cleanup
• Ticker validation caching for reliable ticker resolution
• Works on all timeframes and instruments
• Comprehensive edge case handling
• Week boundary detection using ta.change(weekofyear)
• Fill confirmation system with configurable bars
For detailed documentation and usage instructions, see the script comments.

VWAP Long Entry PROVWAP Long Entry PRO - Instruction Manual
Overview
VWAP Long Entry PRO is a Pine Script v6 indicator designed for day traders following Andrew Aziz's VWAP trading methodology from "How to Day Trade for a Living." The indicator identifies high-probability long entry opportunities when stocks bounce off VWAP with proper trend, volume, and timing confirmation.
What This Indicator Does
The indicator monitors multiple conditions simultaneously and alerts you only when ALL criteria are met for a valid VWAP long entry:
1. ✅ Price is near VWAP (within customizable proximity)
2. ✅ Price crosses above VWAP (bullish candle confirmation)
3. ✅ Uptrend confirmed (EMA 20 > EMA 50)
4. ✅ Volume spike present (volume > 1.5x average)
5. ✅ Within optimal trading hours (default: first 2 hours after market open)
Visual Elements on the Chart
1. VWAP Line (Yellow)
* Shows the Volume Weighted Average Price for the current session
* Acts as dynamic support/resistance
2. EMA Lines
* Blue Line: 20-period Exponential Moving Average
* Red Line: 50-period Exponential Moving Average
* Trend is bullish when blue is above red
3. Green Triangle Markers
* Appear below candles when ALL entry conditions are met
* These are your entry signals
4. Background Colors
* Light Yellow Background: Price is within proximity zone of VWAP
* Light Red Background: Price crossed VWAP but filters failed (helps identify missed opportunities)
5. Filter Status Table (Top Right)
Real-time dashboard showing current status of all filters:
Filter Status
Trend ✓ (green) or ✗ (red)
Volume ✓ (green) or ✗ (red)
Time ✓ (green) or ✗ (red)
Near VWAP ✓ (green) or ✗ (red)
Entry OK ✓ GO (lime) or ✗ (orange)
How to Use the Indicator
Step 1: Apply to Your Watchlist
1. Add VWAP Long Entry PRO to charts of stocks on your morning gappers watchlist
2. Use 1-minute, 2-minute, or 5-minute timeframes
3. Monitor multiple stocks simultaneously
Step 2: Wait for Setup
Watch the Filter Status Table in the top right corner. A valid entry requires:
* All filters showing green ✓
* "Entry OK" showing ✓ GO in lime/green
Step 3: Execute the Trade
When a green triangle appears below a candle:
* Entry: Enter long at or near the close of that candle
* Stop Loss: Place stop just below VWAP (typically 2-5 cents below)
* Profit Target: Use resistance levels, previous highs, or VWAP + ATR
Step 4: Manage the Trade
* Hold as long as price stays above VWAP
* Exit if price closes back below VWAP
* Scale out at resistance levels
Customizable Settings
Access settings by clicking the gear icon next to the indicator name.
VWAP Proximity
* Default: 0.002 (0.2%)
* Purpose: Defines how close price must be to VWAP
* Adjust If:
* Too many signals → increase (e.g., 0.001 = 0.1%)
* Too few signals → decrease (e.g., 0.003 = 0.3%)
Filters Group
Trend Filter
* Use Trend Filter: Toggle on/off
* EMA 20 Length: Default 20
* EMA 50 Length: Default 50
* Purpose: Ensures you're trading with the trend
* Disable If: Trading reversals or range-bound stocks
Volume Filter
* Use Volume Filter: Toggle on/off
* Volume Multiplier: Default 1.5 (volume must be 1.5x average)
* Volume Average Period: Default 20 bars
* Purpose: Confirms institutional participation
* Adjust If:
* Too restrictive → lower to 1.2x
* Need stronger confirmation → increase to 2.0x
Time Filter
* Use Time Filter: Toggle on/off
* Start Hour (EST): Default 9
* Start Minute: Default 30
* Hours to Trade: Default 2
* Purpose: Focus on highest probability time window (9:30-11:30 AM EST)
* Adjust If:
* Trading afternoon momentum → extend hours to 4-6
* Power hour trading → change start to 15:00, 1 hour
Alert Setup
Creating an Alert
1. Click the Alert Icon (clock) in top toolbar
2. Condition: Select "VWAP Long Entry PRO"
3. Alert Trigger: Choose "VWAP Long Entry PRO"
4. Options: Select "Once Per Bar Close"
5. Expiration: Set to desired timeframe (default: 60 days)
6. Alert Actions: Enable:
* ✓ Notify on App
* ✓ Show Popup
* ✓ Send Email (optional)
* ✓ Play Sound
7. Message: The default message includes:
* Ticker symbol
* Close price
* VWAP value
* Confirmation that all filters passed
Multi-Symbol Alert
To monitor multiple stocks with one alert:
1. In the alert creation dialog, use the Symbol dropdown
2. Select multiple tickers from your watchlist
3. The alert will fire when ANY of those stocks meet the criteria
Trading Strategy
Based on Andrew Aziz's VWAP Methodology
Setup Requirements:
* Stock must be "in play" (gap, news, high relative volume from morning scanner)
* Price pulls back to VWAP during the trading day
* VWAP acts as support for longs (or resistance for shorts)
Entry Rules:
1. Wait for price to approach VWAP
2. Confirm VWAP as support with a bullish candle closing above it
3. Enter long on confirmation candle close or next candle open
4. All filters (trend, volume, time) must be green
Stop Loss:
* Place stop 2-5 cents below VWAP
* Adjust based on stock volatility and your risk tolerance
Profit Targets:
* First target: Previous resistance or swing high
* Second target: Daily pivot or Fibonacci extension
* Trailing stop: Move stop to breakeven once up 1:1 risk/reward
Risk Management:
* Risk 1-2% of account per trade
* Position size based on distance from stop loss
* Aim for 2:1 or 3:1 reward-to-risk ratio
Common Scenarios
Scenario 1: Clean VWAP Bounce
* All filters green ✓
* Price pulls back to VWAP
* Green triangle appears
* Action: Enter long immediately
Scenario 2: Failed Volume
* Trend ✓, Time ✓, Near VWAP ✓
* Volume ✗ (red X)
* Action: Wait for volume increase or skip trade
Scenario 3: Wrong Time Window
* All filters green except Time ✗
* Action: If you trade mid-day, consider extending time window in settings
Scenario 4: Downtrend
* Trend ✗ (EMA 20 < EMA 50)
* Action: Skip long entry; consider short setup instead
Scenario 5: False Breakout
* Light red background appears (filters failed)
* Price crossed VWAP but no confirmation
* Action: No entry; indicator correctly filtered out weak signal
Best Practices
1. Pre-Market Preparation
* Run your gappers scanner at 9:00 AM EST
* Identify 3-5 stocks "in play"
* Add VWAP Long Entry PRO to each chart
* Set up alerts for your watchlist
2. Chart Timeframe Selection
* 1-minute: Scalping, high-frequency entries (more signals, more noise)
* 2-minute: Balanced (recommended for beginners)
* 5-minute: Swing entries, fewer but higher-quality signals
3. Combine with Price Action
The indicator is a filter and alert system, not a complete strategy. Also consider:
* Support/resistance levels
* Candlestick patterns (hammer, engulfing)
* Overall market trend (SPY, QQQ)
* Stock-specific news and catalysts
4. Backtesting
* Use TradingView's Bar Replay feature
* Review past signals on your favorite stocks
* Adjust filter settings based on your results
* Document win rate and average R:R
5. Paper Trading First
* Test the indicator with paper trading for 1-2 weeks
* Track all signals and outcomes
* Refine settings before risking real capital
Troubleshooting
Problem: No Signals Appearing
Solutions:
* Check if all filters are enabled (they may be too restrictive)
* Verify stock has sufficient volume and volatility
* Try increasing VWAP proximity from 0.2% to 0.3%
* Disable time filter if trading mid-day
* Check if stock is actually near VWAP on chart
Problem: Too Many Signals
Solutions:
* Decrease VWAP proximity from 0.2% to 0.1%
* Increase volume multiplier from 1.5x to 2.0x
* Enable all filters (trend, volume, time)
* Use 5-minute chart instead of 1-minute
Problem: Filter Status Table Not Visible
Solutions:
* Scroll chart to right (table is in top right corner)
* Check if indicator is loaded (should appear in indicator list on left)
* Refresh chart and re-add indicator
* Close other overlapping indicators
Problem: Alert Not Firing
Solutions:
* Verify alert is set to "Once Per Bar Close" (not "Only Once")
* Check alert hasn't expired
* Ensure correct symbols are selected in alert
* Confirm indicator is applied to chart with alert
Limitations
What This Indicator Does NOT Do:
* ❌ Automatically enter/exit trades
* ❌ Calculate position size
* ❌ Account for fundamental news or earnings
* ❌ Work on stocks without sufficient liquidity
* ❌ Guarantee profitable trades
When NOT to Use:
* Pre-market or after-hours (VWAP resets at market open)
* Low-volume penny stocks (< 100K daily volume)
* Stocks without clear trend or catalyst
* During major news events or FOMC meetings
* First 5 minutes after market open (price discovery phase)
Example Trade Walkthrough
Stock: XYZ (from morning gappers, +5% gap on earnings)
Time: 10:15 AM EST
Timeframe: 2-minute chart
Filter Status Table Shows:
* Trend: ✓ (EMA 20 > EMA 50)
* Volume: ✓ (2.3x average)
* Time: ✓ (within 9:30-11:30 window)
* Near VWAP: ✓ (price at $50.05, VWAP at $50.00)
* Entry OK: ✗ (waiting for bullish close)
Next Candle:
* Opens at $50.02
* Drops to $49.98 (testing VWAP)
* Closes at $50.08 (bullish candle, above VWAP)
* Green triangle appears!
* Entry OK: ✓ GO
Trade Execution:
* Entry: $50.10 (next candle open)
* Stop Loss: $49.95 (5 cents below VWAP)
* Risk: $0.15 per share
* Target 1: $50.40 (previous resistance) = 2:1 R:R
* Target 2: $50.70 (daily high) = 4:1 R:R
Outcome:
* Price rallies to $50.45
* Scale out 50% at Target 1
* Move stop to breakeven ($50.10)
* Exit remaining 50% at $50.65
* Result: Profitable trade with 3:1 average R:R
Frequently Asked Questions
Q: Can I use this for short entries?
A: The current version is for long entries only. For shorts, you'd need to reverse the logic (price rejecting VWAP as resistance, downtrend, etc.).
Q: What stocks work best with this indicator?
A: Mid-cap momentum stocks ($1B-$10B market cap), price $10-$100, daily volume > 1M, with a clear catalyst (earnings, news, sector move).
Q: Can I trade this on daily or weekly charts?
A: No. VWAP is an intraday indicator that resets each trading day. Use only on intraday timeframes (1m, 2m, 5m, 15m, 30m).
Q: Should I take every signal?
A: No. Use the indicator as a filter, not a mechanical system. Consider overall market conditions, stock-specific catalysts, and your own price action analysis.
Q: How accurate is this indicator?
A: Accuracy depends on market conditions, stock selection, and your execution. Expect 50-65% win rate with proper 2:1+ risk/reward, similar to Aziz's methodology.
Resources
* Book: "How to Day Trade for a Living" by Andrew Aziz
* VWAP Strategy: Focus on Chapters 7.6 (VWAP Strategy) and supporting examples
* Community: Bear Bull Traders (www.bearbulltraders.com)
* Practice: Use TradingView's Bar Replay and Paper Trading features
Support & Updates
For questions, issues, or feature requests, refer to the TradingView script comments or the Bear Bull Traders community.
Version: 1.0
Pine Script Version: v6
Last Updated: December 30, 2025
Disclaimer: This indicator is for educational purposes only. Trading involves substantial risk. Past performance does not guarantee future results. Always practice proper risk management and never risk more than you can afford to lose.
1. www.tradingview.com

Auto Liquidity Sweep Trendlines Flexible By VJhaThis auto liquidity sweep trendline is more flexible in that it offers you choice to make different pivot bars for Green and Red lines. Points to draw these trendlines are not ordinary and arbitrary wicks, rather they are most impactful liquidity sweeps, making them worthy of reliablility.
This is helpful to choose bigger bar numbers for longer trend and smaller bar number even 1 for pullback trend giving you sniper entry: in case you have missed the larger trend.
Say goodbye to manual trendline drawing with this tool in place, once and for all.
Happy trading.

Gann VooDoo LinesGann VooDoo Lines Indicator
Description
- Gann VooDoo Lines is a precise overlay indicator that applies W.D. Gann's Square of 9 mathematics to generate static horizontal support and resistance levels from a single manual anchor price. It calculates 8 key vibrational degrees (45°, 90°, 135°, 180°, 225°, 270°, 315°, 360°) both upward (resistance) and downward (support), delivering clean, timeframe-independent price zones.
Key Features
- Manual anchor price input for complete control
- Individual toggles for each of the 8 degrees
- "Both (Support + Resistance)" mode to display levels in both directions simultaneously
- Extend lines left/right or both
- Dynamic right-side labels that follow the latest bar
- Price values automatically displayed on the right price scale for all visible lines (including anchor)
- Customizable resistance, support, and anchor colors
What Makes It Unique (Compared to Other Gann Scripts)
- Unlike most Gann indicators on TradingView (which typically focus on sloping angles/fans, auto-detected swings, or limited degrees), Gann VooDoo Lines uses pure static Square of 9 horizontal levels with full individual toggles for all 8 degrees and a dedicated "Both" mode — allowing you to view support and resistance simultaneously without overlap or clutter. The combination of per-degree toggles, dynamic right-side labels, and clean price scale integration (no duplicates or repainting) sets it apart from generic Gann tools that often lack this granular control and visual clarity.
How to Use and Trade With It
- Set the anchor properly — this is the most critical step:
- Choose a major significant price extreme (all-time high/low, major swing high/low, or key psychological level).
- For higher timeframes (daily/weekly): use long-term extremes (e.g., all-time low/high) for "master" levels that influence price over months/years.
- For lower timeframes/intraday: use recent session extremes (today's open, previous close, or recent swing high/low) and update the anchor as needed for fresh levels.
- Experiment: test different anchors and observe which produces the most reactions.
Trading approach:
- Watch for price reactions (reversals, bounces, accelerations) at the lines — especially confluence with multiple degrees or right-side labels.
- Use in "Both" mode for full support/resistance picture.
- Combine with price action (candlestick patterns, volume) for entries/exits.
- Toggle off unused degrees to declutter the chart.

Triple EMA + Key Levels [Scalping-Algo]TITLE: Triple EMA Day Trading System with Multi-Timeframe Support/Resistance Levels
DESCRIPTION:
📊 Overview
This indicator combines trend-following EMAs with key historical price levels to create a complete day trading toolkit. It helps traders identify trend direction while highlighting important support and resistance zones from multiple timeframes.
🎯 Purpose & Trading Application
Day traders often need to quickly assess:
1. Current trend direction (using EMAs)
2. Key price levels where reversals or breakouts may occur
This indicator solves both needs in one tool, reducing chart clutter from multiple indicators.
📈 How It Works
TREND IDENTIFICATION (EMAs):
- EMA 13 (Yellow): Fast EMA for short-term momentum and entry timing
- EMA 48 (Purple): Medium EMA for intraday trend direction
- EMA 200 (Red): Slow EMA for overall trend bias
Trading Logic:
- When price is above all 3 EMAs = Strong bullish bias
- When price is below all 3 EMAs = Strong bearish bias
- EMA crossovers signal potential trend changes
- The 13/48 crossover is particularly useful for intraday entries
SUPPORT & RESISTANCE LEVELS:
- Previous Day High/Low (Green, Solid): Most recent daily range - high probability reaction zones
- 2-Day High/Low (Blue, Dashed): Extended lookback for stronger levels
- Previous Week High/Low (Orange, Dotted): Major institutional levels
Why These Levels Matter:
Previous day and weekly highs/lows are watched by many traders and algorithms. Price often:
- Reverses at these levels (support/resistance)
- Accelerates through them (breakout trades)
🔧 How To Use
FOR TREND TRADING:
1. Identify bias using EMA stack (all 3 aligned = strong trend)
2. Look for pullbacks to EMA 13 or 48 for entries
3. Use key levels as profit targets
FOR REVERSAL TRADING:
1. Watch for price approaching previous day/week levels
2. Look for rejection candles at these levels
3. Use EMA 13 break as confirmation
FOR BREAKOUT TRADING:
1. Identify consolidation near key levels
2. Enter on break of level with volume
3. Use opposite level as target
⚙️ Settings
All parameters are fixed for simplicity:
- EMAs: 13, 48, 200 periods
- Levels: Previous Day, 2-Day, Previous Week
- All lines thickness: 2
📝 Notes
- Best used on intraday timeframes (1min to 1hour)
- Levels update automatically each day/week
- Labels on right side identify each level (PDH, PDL, 2DH, 2DL, PWH, PWL)
---
TAGS: ema, daytrading, support, resistance, levels, intraday, trend, scalping, swingtrading

Gamma Levels - Options Flow# 📊 Gamma Levels - Options Flow Indicator
## TradingView Free Indicator - By AsiaQuant
---
## 🎯 What Is This?
**Gamma Levels** is a simplified TradingView indicator that shows estimated support and resistance levels based on institutional options positioning. It helps traders identify key price zones where options market makers are likely positioned.
### Key Features:
- **⚡ Gamma Flip Level**: The inflection point where dealer hedging behavior changes
- **🔴 Call Wall**: Overhead resistance from call option concentration
- **🟢 Put Support**: Downside support from put option concentration
- **🎯 Trading Zone**: The range between support and resistance
- **📊 Regime Detection**: Positive vs Negative Gamma environments
---
## 📈 How To Use
### 1. **Gamma Flip Level (⚡)**
The Gamma Flip is the most critical level. It represents where market maker hedging flips from stabilizing to destabilizing:
- **Above Gamma Flip**: Positive gamma environment → Lower volatility, mean reversion
- **Below Gamma Flip**: Negative gamma environment → Higher volatility, trend continuation
**Trading Strategy:**
- When price is **above** gamma flip: Fade extremes, trade ranges
- When price is **below** gamma flip: Follow momentum, breakouts more likely
### 2. **Call Wall (🔴)**
The Call Wall represents overhead resistance where heavy call open interest sits:
- Acts as a **magnet** when price approaches from below
- Acts as **resistance** when price tests it
- Breaking above often leads to squeeze moves
**Trading Strategy:**
- Use as profit target for long positions
- Watch for rejection and reversal setups
- Breaking through = potential gamma squeeze
### 3. **Put Support (🟢)**
The Put Support level shows where heavy put positioning provides downside support:
- Acts as **support** on pullbacks
- Breaking below signals bearish momentum
- Often bounces near this level
**Trading Strategy:**
- Use as entry zone for long positions
- Stop loss just below this level
- Breaking through = potential flush lower
### 4. **Trading Zone (Blue Shaded Area)**
The zone between Call Wall and Put Support shows the expected trading range:
- **Narrow zones** = Low volatility, potential breakout setup
- **Wide zones** = High volatility, choppy action expected
- Price tends to stay within this zone
---
## 🚦 Regime Guide
### Positive Gamma Regime (Green Background)
- Price above Gamma Flip
- Lower volatility expected
- Mean reversion strategies work better
- Selling premium strategies favorable
### Negative Gamma Regime (Red Background)
- Price below Gamma Flip
- Higher volatility expected
- Trend following strategies work better
- Directional trades more profitable
---
## ⚠️ Important Limitations
This is a **SIMPLIFIED** indicator that uses price action and volume as proxies for options positioning. It does NOT use real options chain data.
### What This Indicator Does:
✅ Estimates levels using VWAP and ATR
✅ Shows general zones of interest
✅ Provides educational framework
✅ Works on any timeframe
### What This Indicator CANNOT Do:
❌ Access real options open interest
❌ Calculate actual gamma exposure
❌ Account for 0DTE dynamics
❌ Include Vanna/Charm effects
❌ Use volatility surface interpolation
---
## 🔓 Want The Full Professional Version?
### **GEX Pro - Institutional Grade Analysis**
**Visit: (gexpro.asiaquant.com)**
#### What You Get:
- ✅ **Real Options Data**: Live OI and volume from actual options chains
- ✅ **20+ Metrics**: GEX, DEX, Vanna, Charm, Volga, IV Skew, and more
- ✅ **0DTE Logic**: Proprietary algorithm for same-day expiration positioning
- ✅ **Volatility Surface**: Cubic spline interpolation eliminates "ghost walls"
- ✅ **Shadow Gamma**: Advanced second-order risk exposure
- ✅ **Multi-Expiration**: Analyze 0DTE, weekly, and monthly expirations simultaneously
- ✅ **Directional Scoring**: AI-powered conviction scoring with 5 components
- ✅ **Trade Ideas**: Specific setups based on positioning
- ✅ **440+ Tickers**: SPY, QQQ, IWM, AAPL, TSLA, NVDA, and more
#### The Difference:
| Feature | TradingView Free | GEX Pro |
|---------|------------------|---------|
| Data Source | Price/Volume Proxy | Real Options Chains |
| Gamma Calculation | Estimated | Actual Black-Scholes |
| Advanced Greeks | ❌ | ✅ Vanna, Charm, Volga |
| 0DTE Handling | ❌ | ✅ Volume Priority |
| Vol Surface | ❌ | ✅ Cubic Spline |
| Conviction Score | ❌ | ✅ 5-Component Model |
| Trade Setups | ❌ | ✅ Directional Ideas |
---
## 📚 Educational Resources
### Recommended Reading:
1. **"Gamma Exposure and Market Dynamics"** - Understanding dealer hedging
2. **"Volatility Trading"** by Euan Sinclair - Options Greeks in practice
3. **"The Volatility Surface"** by Jim Gatheral - Advanced vol modeling
### Key Concepts:
- **Gamma Exposure (GEX)**: The rate of change of delta with respect to price
- **Dealer Hedging**: How market makers adjust their stock positions
- **Positive Gamma**: Dealers buy dips, sell rips → stabilizing
- **Negative Gamma**: Dealers sell dips, buy rips → destabilizing
- **Vanna**: Sensitivity to spot and volatility changes
- **Charm**: Time decay of delta
---
## 🎓 Best Practices
### ✅ DO:
- Use in conjunction with price action and volume
- Combine with support/resistance levels
- Pay attention to regime changes
- Use for planning entries/exits
- Monitor gamma flip proximity
### ❌ DON'T:
- Rely solely on this indicator
- Ignore overall market conditions
- Trade against strong trends
- Over-leverage based on levels
- Treat estimates as absolute truth
---
## 📊 Example Scenarios
### Scenario 1: Approaching Call Wall
- Price rallies toward Call Wall ($595 on SPY)
- Volume increases as it approaches
- **Action**: Consider taking profits on longs, watch for rejection
### Scenario 2: Gamma Flip Cross
- Price crosses below Gamma Flip
- Regime changes to Negative Gamma
- **Action**: Reduce range trading, prepare for momentum
### Scenario 3: Bouncing Off Put Support
- Price tests Put Support ($580 on SPY)
- High volume at the test
- **Action**: Entry for longs with stop below support
---
## 🔧 Settings Guide
### Lookback Period (Default: 20)
- **Lower (10-15)**: More responsive, better for day trading
- **Higher (30-50)**: Smoother, better for swing trading
### Volatility Multiplier (Default: 1.5)
- **Lower (1.0-1.2)**: Tighter zones, more frequent tests
- **Higher (2.0-3.0)**: Wider zones, fewer tests but stronger
### Display Options
- Toggle individual levels on/off based on your strategy
- Customize colors to match your chart theme
---
## ❓ FAQ
**Q: Why don't the levels match actual options strikes?**
A: This free version uses price action approximations. For real strike-level precision, use GEX Pro.
**Q: How often should levels update?**
A: The indicator recalculates every bar. For real options data that updates throughout the day, use GEX Pro.
**Q: Can I use this for day trading?**
A: Yes, but it's approximations. For intraday 0DTE positioning, GEX Pro has specialized logic.
**Q: What timeframe works best?**
A: Works on all timeframes, but 15min-1hour is optimal for the simplified calculation.
**Q: Is this better than just support/resistance?**
A: It adds an options perspective, but should complement (not replace) standard TA.
---
## 🚀 Upgrade To GEX Pro
Ready for institutional-grade analysis?
### ** (gexpro.asiaquant.com)**
- Real options data from 440+ tickers
- 20+ advanced metrics
- AI-powered trade signals
- Professional-grade analytics
- API access available
**Stop guessing. Start knowing where the institutions are positioned.**
---
## 📧 Support & Contact
- **Website**: (gexpro.asiaquant.com)
- **Questions**: Contact form on website
- **TradingView**: Leave comments on the indicator
---
## ⚖️ Disclaimer
This indicator is for **educational purposes only**. It is not financial advice. Options and derivatives trading involves significant risk. Past performance does not guarantee future results. Always do your own research and consult with a financial advisor before making trading decisions.
The simplified calculations in this free version are approximations and may not reflect actual market conditions. For professional trading decisions, use verified data sources and professional-grade tools.
---
**Version**: 1.0
**Last Updated**: December 2024
**Created By**: AsiaQuant Research
### 🔓 **Unlock the full power: (gexpro.asiaquant.com)**

Gann Octave 8 Ver.2.0Gann Octave 8 Ver.2.0 - Complete Trading Guide
Overview
This indicator combines W.D. Gann's time-tested principles of market geometry with modern technical analysis. It identifies key market structures and projects precise support/resistance levels along with angular momentum lines to help traders identify high-probability trading opportunities.
________________________________________
Core Concepts
1. Gann's Octave Division (The Rule of 8)
W.D. Gann discovered that markets move in harmonic divisions based on the number 8. This indicator divides any swing movement into 8 equal parts (octaves):
• 0% - Swing extreme (High for bearish, Low for bullish)
• 12.5% - First octave
• 25% - Quarter level
• 37.5% - Three-eighths level
• 50% - Midpoint (most critical level)
• 62.5% - Five-eighths level
• 75% - Three-quarter level
• 87.5% - Seventh octave
• 100% - Swing extreme (opposite end)
Why 8? Gann believed natural market cycles follow mathematical harmonics. The octave division provides precise entry and exit points that frequently act as support/resistance zones.
2. Gann Angles (Price-Time Relationship)
Gann angles represent the relationship between price movement and time. Each angle shows different momentum levels:
• 1x1 (Black) - 45° angle, perfect balance between price and time. Most important Gann angle. Represents the natural trend line.
• 2x1 (Red) - Steeper angle, 2 units of price per 1 unit of time. Shows strong momentum.
• 1x2 (Red) - Flatter angle, 1 unit of price per 2 units of time. Shows weak momentum.
• 4x1 & 1x4 (Blue) - Even more extreme angles indicating very strong or very weak trends.
• 8x1 & 1x8 (Orange) - Most extreme angles, parabolic moves or complete consolidation.
Key Principle: When price is above the 1x1 angle = bullish. Below 1x1 = bearish. When price crosses from one angle to another, it signals a change in momentum.
________________________________________
How the Indicator Works
Structure Detection
The indicator automatically identifies market swings using pivot points:
1. Bullish Structure (Green): Detected when price makes a higher high
o Octave levels calculated from swing low (0%) to swing high (100%)
o Gann angles project upward from the swing low
2. Bearish Structure (Red): Detected when price makes a lower low
o Octave levels calculated from swing high (0%) to swing low (100%)
o Gann angles project downward from the swing high
Dynamic Updates
• Swing Tracker ON: Levels update continuously as the swing evolves
• Swing Tracker OFF: Levels lock at the initial swing detection (cleaner charts)
Historical Structures
The indicator maintains previous swing structures based on "Number of Swings to Show":
• Set to 1: Only current structure (cleanest)
• Set to 2-3: Current + recent history (recommended for context)
• Set to 4+: Multiple historical structures (may overlap but shows pattern)
________________________________________
Trading Strategy
Entry Signals
BUY SIGNALS (Green Triangle Up ▲)
Signal 1: Bounce from Support Levels
• Price drops to 0%, 50%, or 100% level and reverses
• Best when combined with bullish candlestick pattern (hammer, engulfing)
• Entry: On signal confirmation
• Stop Loss: Below the support level (0.5-1% below)
• Target: Next octave level up (12.5%, 25%, 50%)
Signal 2: Breakout Above Resistance
• Price breaks above 50% or 100% level with momentum
• Confirms trend continuation or reversal
• Entry: On close above the level
• Stop Loss: Below the breakout level
• Target: Previous swing high or next major level
Signal 3: Gann Angle Support
• Price bounces off 1x1 angle (black line)
• Indicates trend is intact
• Entry: When price respects the angle
• Stop Loss: Below the 1x1 angle
• Target: Next resistance level
SELL SIGNALS (Red Triangle Down ▼)
Signal 1: Rejection from Resistance Levels
• Price rallies to 0%, 50%, or 100% level and reverses
• Best when combined with bearish candlestick pattern (shooting star, bearish engulfing)
• Entry: On signal confirmation
• Stop Loss: Above the resistance level (0.5-1% above)
• Target: Next octave level down (87.5%, 75%, 50%)
Signal 2: Breakdown Below Support
• Price breaks below 50% or 0% level with momentum
• Confirms trend continuation or reversal
• Entry: On close below the level
• Stop Loss: Above the breakdown level
• Target: Previous swing low or next major level
Signal 3: Gann Angle Resistance
• Price fails at 1x1 angle (black line)
• Indicates trend weakness
• Entry: When price rejects the angle
• Stop Loss: Above the 1x1 angle
• Target: Next support level
________________________________________
Advanced Trading Techniques
1. The 50% Rule (Most Powerful)
The 50% octave level is the most critical in Gann theory:
• In Uptrend: Price should not break below 50% retracement. If it holds = trend intact, go long.
• In Downtrend: Price should not break above 50% retracement. If it holds = trend intact, go short.
• Reversal: Breaking and closing beyond 50% often signals trend reversal.
2. Gann Angle Confluence
When multiple Gann angles converge with octave levels = HIGH probability zone:
• Look for price to bounce or reverse at these zones
• Example: 1x2 angle meets 50% level = strong support/resistance
• These zones often become pivot points
3. Multiple Timeframe Analysis
• Use higher timeframe (daily) for major structure
• Use lower timeframe (5min, 15min) for precise entries
• Take trades when both timeframes align
4. Swing Failure Pattern
• Price breaks a key level (e.g., 50%) but quickly reverses back
• This "false breakout" often leads to strong move in opposite direction
• Wait for signal in the reversal direction
________________________________________
Settings Optimization
For Day Trading (Scalping)
• Structure Period: 0-2 (22 bars or less)
• Number of Swings: 1 (only current structure)
• Signal Sensitivity: High
• Swing Tracker: OFF (cleaner)
For Swing Trading
• Structure Period: 4-5 (44-88 bars)
• Number of Swings: 2-3
• Signal Sensitivity: Medium
• Swing Tracker: ON or OFF (preference)
For Position Trading
• Structure Period: 6-8 (176+ bars)
• Number of Swings: 3-5
• Signal Sensitivity: Low
• Swing Tracker: ON
________________________________________
Common Patterns to Watch
Bullish Reversal Setup
1. Price in bearish structure (red levels)
2. Price drops to 100% level (swing low)
3. Buy signal appears (green triangle)
4. Price breaks back above 50% level
5. Action: Go long with stop below 100%
Bearish Reversal Setup
1. Price in bullish structure (green levels)
2. Price rises to 100% level (swing high)
3. Sell signal appears (red triangle)
4. Price breaks back below 50% level
5. Action: Go short with stop above 100%
Trend Continuation
1. Price respects 1x1 Gann angle
2. Small pullback to 25% or 37.5% level
3. Buy/sell signal appears
4. Action: Enter in trend direction
________________________________________
________________________________________
Signal Sensitivity Guide
• Low: Conservative, only major breakouts (3-5 signals per day)
• Medium: Balanced, includes approaches (5-10 signals per day)
• High: Aggressive, includes bounces (10-20 signals per day)
Choose based on your trading style and risk tolerance
________________________________________
Final Words
This indicator is a powerful tool, but remember:
"The market is never wrong. Opinions are." - W.D. Gann
• No indicator is 100% accurate
• Always combine with price action and volume
• Backtest on your instrument and timeframe
• Keep learning and adapting your strategy
• Discipline and risk management are more important than the perfect setup
Happy Trading! 📈

Alpha Options System# Apex Options Sniper - Advanced Multi-Signal Day Trading System
## 🎯 Overview
**Apex Options Sniper** is a professional-grade, multi-signal trading indicator specifically engineered for high-probability day trading of weekly options. This comprehensive system combines 10+ technical indicators into a sophisticated scoring algorithm that identifies optimal entry points with institutional-level precision.
Perfect for traders of SPY, QQQ, and high-volume stocks, this indicator eliminates guesswork by providing clear BUY CALLS and BUY PUTS signals based on multiple technical confluences.
---
## 🚀 Key Features
### **Multi-Signal Confluence Engine**
- **10+ Technical Indicators** working in harmony
- **Weighted Scoring System** (0-30+ points) for signal strength
- **Real-time Signal Classification**: Strong vs Moderate signals
- **False Signal Reduction** through multi-confirmation requirements
### **Advanced Momentum Analysis**
- ✅ RSI with Divergence Detection (bullish & bearish)
- ✅ Stochastic Oscillator (oversold/overbought + crossovers)
- ✅ MACD with crossover and momentum confirmation
- ✅ Automatic divergence spotting for reversal trades
### **Sophisticated Trend Detection**
- ✅ Triple EMA System (9/21/50) with alignment scoring
- ✅ SuperTrend Indicator with trend flip alerts
- ✅ VWAP for institutional price levels
- ✅ Multi-timeframe trend confirmation
### **Professional Volume Analysis**
- ✅ Volume Spike Detection (vs 20-period average)
- ✅ OBV (On-Balance Volume) with divergence detection
- ✅ Order Flow Analysis (buy vs sell pressure)
- ✅ Relative volume ratio display
### **Advanced Pattern Recognition**
- ✅ Bollinger Band Squeeze detection (volatility expansion)
- ✅ BB breakout signals (major move initiation)
- ✅ Automatic Support & Resistance levels (pivot-based)
- ✅ Price reaction scoring at key levels
### **Built-in Risk Management**
- ✅ ATR-based Stop Loss calculations
- ✅ Customizable Risk:Reward ratios
- ✅ Position sizing recommendations
- ✅ Real-time profit target calculations
### **Comprehensive Visual Dashboard**
- ✅ Live scoring breakdown for all indicators
- ✅ Individual signal strength display
- ✅ Bull vs Bear score comparison
- ✅ Color-coded signal status
- ✅ Risk management metrics
---
## 📊 How It Works
### **Scoring System**
The indicator assigns points based on technical conditions:
| **Category** | **Max Points** | **Conditions** |
|-------------|---------------|----------------|
| Momentum (RSI/Stoch) | 8 | Oversold/overbought + divergences |
| MACD | 4 | Crossovers + momentum direction |
| Trend (EMAs) | 6 | EMA alignment + SuperTrend |
| Volume | 4 | Spikes + OBV divergences |
| Order Flow | 2 | Buy/sell pressure imbalance |
| Bollinger Bands | 2 | Squeeze + breakouts |
| Support/Resistance | 2 | Price at key levels |
| VWAP | 1 | Above/below institutional level |
### **Signal Thresholds**
- **🚀 STRONG CALLS**: Bull score ≥6, Net score ≥4
- **📈 CALLS**: Bull score ≥4, Net score ≥2
- **🔥 STRONG PUTS**: Bear score ≥6, Net score ≤-4
- **📉 PUTS**: Bear score ≥4, Net score ≤-2
### **Multi-Timeframe Filter**
Optional higher timeframe confirmation reduces false signals by ensuring the broader trend supports your trade direction.
---
## 🎮 How to Use
### **Installation**
1. Open TradingView Pine Editor
2. Paste the complete indicator code
3. Click "Add to Chart"
4. Customize settings to your preference
### **Recommended Settings**
**For SPY/QQQ Day Trading:**
- Timeframe: 1-minute or 5-minute
- Strong Signal Threshold: 6
- Moderate Signal Threshold: 4
- Multi-timeframe Confluence: ON
**For Individual Stocks:**
- Timeframe: 5-minute or 15-minute
- Increase SuperTrend multiplier to 3.5-4.0
- Enable all advanced features
**For Scalping:**
- Timeframe: 1-minute
- Use STRONG signals only (6+)
- Tight stop loss (1.0-1.5 ATR multiplier)
### **Best Trading Times**
- **9:30-11:00 AM EST** - Highest volume, strongest signals
- **2:00-4:00 PM EST** - Afternoon momentum plays
- Avoid 11:30 AM-1:30 PM EST (lunch chop)
---
## 📈 Signal Interpretation
### **What You'll See on Chart:**
**Visual Signals:**
- 🟢 **Green Triangle (CALLS)**: Bullish entry point
- 🟢 **Large Green Triangle (STRONG CALLS)**: High-confidence bullish entry
- 🔴 **Red Triangle (PUTS)**: Bearish entry point
- 🔴 **Large Red Triangle (STRONG PUTS)**: High-confidence bearish entry
- 💎 **Small Diamonds**: RSI/OBV divergences (reversal warning)
**Dashboard Information:**
- Individual indicator values and signals
- Real-time score breakdown
- Bull/Bear score totals
- ATR stop loss levels
### **Entry Rules:**
✅ **High Probability Trades (Take These):**
- Strong signal (6+ score)
- 3+ indicators confirming
- Volume spike present
- SuperTrend aligned
- Higher timeframe confirms
⚠️ **Moderate Trades (Smaller Position):**
- Moderate signal (4-5 score)
- 2+ indicators confirming
- Normal volume
- Mixed trend signals
❌ **Avoid These:**
- Conflicting signals (Bull score ≈ Bear score)
- Low volume
- During major news events
- Bollinger squeeze without breakout direction
---
## 🛡️ Risk Management Guide
### **Position Sizing:**
- **Strong Signals (6+)**: 3-5% of portfolio
- **Moderate Signals (4-5)**: 2-3% of portfolio
- **Low Conviction**: 1-2% or skip
### **Stop Loss Strategy:**
- Use ATR-based stops (displayed in dashboard)
- Default: 1.5x ATR from entry
- Weekly options: 30-50% premium loss maximum
- Never hold through stop loss hoping for recovery
### **Profit Targets:**
- **Quick Scalps**: 25-50% gain (15-30 min)
- **Day Trades**: 50-100% gain (same day exit)
- **Swing**: 100-200% gain (1-2 days max for weeklies)
- **Take partial profits** at first target, let rest run
### **Time Decay Management (Weekly Options):**
- Monday-Wednesday: Hold overnight acceptable on strong signals
- Thursday: Close by EOD unless very strong conviction
- Friday: Avoid holding overnight, theta decay accelerates
---
## 🔔 Alert Configuration
### **Recommended Alerts:**
**Essential Alerts:**
1. 🚀 Strong Buy Calls
2. 🔥 Strong Buy Puts
**Advanced Alerts:**
3. 💎 RSI Bullish Divergence
4. ⚠️ RSI Bearish Divergence
5. 🔶 Bollinger Band Squeeze
6. ✅ SuperTrend Bull Flip
7. ❌ SuperTrend Bear Flip
**Alert Setup:**
- Set frequency: "Once Per Bar Close"
- Enable for all devices
- Use webhook for automation (optional)
---
## 💡 Pro Trading Tips
### **Maximize Win Rate:**
1. **Wait for confluence** - Best trades have 3+ indicators aligned
2. **Respect the dashboard** - Check WHY it's signaling (which indicators)
3. **Volume is king** - Signals with volume spikes are significantly more reliable
4. **Use BB Squeeze** - When squeeze + signal = explosive directional move
5. **SuperTrend flips** - Major trend change confirmations, very powerful
6. **Watch for divergences** - Diamond markers = hidden reversal opportunities
### **Common Mistakes to Avoid:**
❌ Trading every signal (be selective)
❌ Ignoring volume (volume confirms everything)
❌ Fighting the higher timeframe trend
❌ Oversizing positions on moderate signals
❌ Holding weekly options too long (theta decay)
❌ Trading during lunch hour (11:30-1:30 EST)
### **Advanced Techniques:**
- **Divergence + Support/Resistance** = Highest probability reversals
- **BB Squeeze + EMA alignment** = Explosive trend continuations
- **SuperTrend flip + Volume spike** = Major trend change entries
- **Multiple timeframe analysis** - Check 5m signal on 1m chart for precision entries
---
## 📊 Indicator Components Explained
### **RSI (Relative Strength Index)**
- Measures momentum and overbought/oversold conditions
- Divergences signal potential reversals before they happen
- Score: 2-3 points for extremes and divergences
### **Stochastic Oscillator**
- Confirms momentum extremes
- Crossovers provide entry timing
- Score: 1-2 points
### **MACD (Moving Average Convergence Divergence)**
- Trend following momentum indicator
- Crossovers signal momentum shifts
- Score: 1-3 points based on signal strength
### **EMA System (9/21/50)**
- Dynamic support and resistance
- Alignment shows trend strength
- Price position relative to EMAs scores 1-2 points
### **SuperTrend**
- Volatility-based trend indicator
- Reduces whipsaws in choppy conditions
- Trend flips are major signals (2 points)
### **Bollinger Bands**
- Volatility measurement
- Squeeze = calm before the storm
- Breakouts = directional move initiation (2 points)
### **Volume Analysis**
- Confirms price movement legitimacy
- Spikes validate signals (2 points)
- OBV divergences predict reversals (2 points)
### **Order Flow**
- Buy vs sell pressure measurement
- Institutional footprint detection
- Score: 2 points for strong imbalances
---
## 🎓 Learning Path
### **Beginner (Week 1-2):**
- Use STRONG signals only
- Focus on high-volume stocks (SPY/QQQ)
- Trade only first hour of market
- Use paper trading first
### **Intermediate (Week 3-4):**
- Add moderate signals to your arsenal
- Learn to read the dashboard
- Understand why each signal triggers
- Start combining with support/resistance
### **Advanced (Month 2+):**
- Use divergence signals
- Trade BB squeeze breakouts
- Optimize settings for your style
- Develop your own confluence rules
---
## ⚙️ Customization Guide
### **Adjustable Parameters:**
**Momentum Settings:**
- RSI Length (default: 14)
- RSI Oversold/Overbought levels (30/70)
- Stochastic Length (14)
**Trend Settings:**
- EMA periods (9/21/50)
- SuperTrend ATR Length (10)
- SuperTrend Multiplier (3.0)
**Volume Settings:**
- Volume MA Length (20)
- Volume Spike Threshold (1.5x)
**Advanced Settings:**
- Bollinger Band Length (20)
- BB Standard Deviation (2.0)
- Pivot Lookback (10)
**Signal Thresholds:**
- Strong Signal Score (default: 6)
- Moderate Signal Score (default: 4)
**Risk Management:**
- ATR Length (14)
- Stop Loss Multiplier (1.5)
- Risk:Reward Ratio (2.0)
---
## 📈 Performance Optimization
### **For Volatile Markets (VIX > 25):**
- Increase SuperTrend multiplier to 4.0
- Raise signal thresholds (+1 point)
- Tighten stop losses (1.0-1.2 ATR)
### **For Ranging Markets:**
- Focus on RSI extremes and divergences
- Use BB squeeze signals
- Ignore moderate signals
- Wait for support/resistance confirmation
### **For Trending Markets:**
- Follow SuperTrend direction religiously
- Use EMA alignment signals
- Allow wider stops (2.0 ATR)
- Take partial profits, let winners run
---
## 🔍 Troubleshooting
**Too Many Signals:**
- Increase signal thresholds to 7/5
- Enable multi-timeframe filter
- Trade only STRONG signals
**Missing Signals:**
- Decrease thresholds to 5/3
- Disable multi-timeframe filter
- Check that all features are enabled
**Whipsaw in Choppy Markets:**
- Increase SuperTrend multiplier
- Require volume spike confirmation
- Avoid trading 11:30 AM-1:30 PM EST
---
## 🏆 Best Practices
✅ **Always check:**
1. Dashboard shows why signal triggered
2. Volume confirms the move
3. Not during news events
4. Adequate time until expiration
✅ **Risk Management:**
1. Never risk more than 2% per trade
2. Use stops religiously
3. Take profits at targets
4. Don't revenge trade
✅ **Journal Your Trades:**
1. Entry price and signal strength
2. Which indicators triggered
3. Exit price and profit/loss
4. What worked and what didn't
---
## 📞 Support & Updates
This indicator is designed to evolve with market conditions. Recommended to:
- Review settings monthly
- Backtest on your favorite instruments
- Adjust thresholds based on your risk tolerance
- Keep a trading journal to track performance
---
## ⚠️ Disclaimer
This indicator is a tool for technical analysis and should not be used as the sole basis for trading decisions. Options trading involves substantial risk and is not suitable for all investors. Past performance does not guarantee future results. Always:
- Do your own research and due diligence
- Never invest more than you can afford to lose
- Consider consulting with a financial advisor
- Practice with paper trading before using real money
- Understand options Greeks (Delta, Theta, Gamma, Vega)
- Be aware of earnings dates and major news events
**No indicator is 100% accurate. Use proper risk management and trade responsibly.**
---
## 📊 Version History
**v1.0 - Initial Release**
- Multi-signal confluence system
- 10+ technical indicators
- Advanced dashboard
- ATR-based risk management
- Comprehensive alert system
---
## 🎯 Final Thoughts
**Apex Options Sniper** transforms complex technical analysis into clear, actionable signals. By combining multiple proven indicators with sophisticated scoring logic, it helps traders identify high-probability setups while managing risk effectively.
**Success Keys:**
- Quality over quantity (be selective)
- Risk management is everything
- Volume confirms the signal
- Confluence increases probability
- Discipline beats emotion
**Trade smart. Trade with confidence. Trade with Apex Options Sniper.**
---
*For questions, suggestions, or to share your success stories, please comment below or send a message.*
**Happy Trading! 🚀📈**

Liquidity ZonesLiquidity Zones
Liquidity Zones is a price-action–based indicator designed to identify high-probability support and resistance areas where liquidity has historically accumulated.
Instead of drawing single lines, the script builds dynamic price zones based on repeated pivot reactions validated by volume, helping traders focus on meaningful levels rather than noise.
How It Works
Pivot Detection
The indicator scans historical price data for pivot highs and pivot lows using a fixed pivot strength.
Each pivot represents a potential liquidity interaction point.
Volume Qualification
A pivot is only considered valid if the volume at the pivot bar exceeds:
Volume SMA × Sensitivity
This filters out weak or low-participation levels and keeps zones formed during strong market interest.
Zone Construction
Nearby pivots are grouped into a single zone if their price difference stays within an ATR-based threshold.
Each time price reacts within this threshold, the zone’s touch count increases.
Once the minimum number of touches is reached, a liquidity zone is drawn and extended to the right.
Adaptive Zone Expansion
As new qualifying pivots appear, zones automatically expand to reflect the true liquidity range instead of staying static.
Dynamic Zone Coloring
Zones update their color in real time based on price position:
Green (Support) → Price is above the zone
Red (Resistance) → Price is below the zone
Gray (In-Zone) → Price is trading inside the zone
This allows instant visual feedback on whether a level is acting as support, resistance, or an active liquidity area.
Settings Overview
Bars to Apply
Controls how much historical data is scanned for liquidity zones.
Volume Sensitivity
Higher values require stronger volume spikes to validate pivots, resulting in fewer but higher-quality zones.
Styling Options
Fully customizable colors and transparency for support, resistance, and in-zone states.
Best Use Cases
Identifying high-liquidity support and resistance zones
Planning entries, exits, and stop placement
Combining with trend-following or momentum indicators
Filtering out weak levels in sideways or choppy markets

Support and ResistanceSupport & Resistance Zones
This indicator automatically identifies support and resistance zones by clustering confirmed pivot highs and lows into statistically valid price areas.
Instead of drawing single horizontal lines, it creates price zones whose width is dynamically controlled using ATR (Average True Range), allowing the zones to adapt to market volatility.
Core Logic
The indicator scans a user-defined number of historical bars and detects pivot highs and pivot lows using a configurable pivot strength.
Each new pivot is evaluated against previously detected zones:
A zone becomes visible only after receiving sufficient confirmation (minimum number of pivot touches).
This ensures that only structurally meaningful levels are drawn.
Zone Construction Rules
Zones are formed by grouping pivot points whose total price range remains within ATR range
Each zone expands dynamically as new pivots confirm it
Zones are drawn as rectangular areas, not lines
Zones extend to the right, remaining active until price structure changes
This approach avoids over-plotting and reduces noise commonly seen in traditional support/resistance tools.
Dynamic Zone Coloring
Zones automatically change color based on current price position:
Support Color → Price is above the zone
Resistance Color → Price is below the zone
Neutral (In-Zone) Color → Price is trading inside the zone
This makes it easy to visually assess market context without additional indicators.
Inputs Explained
Logic Settings
Bars to Apply
Number of historical bars scanned to detect pivots and construct zones.
Pivot Strength
Number of candles required on both sides of a pivot high/low for confirmation.
Min Pivot Confirmation
Minimum number of aligned pivots required before a zone is drawn.
Styling
Support, resistance, and in-zone colors
Zone fill transparency
Why This Approach
Uses price structure, not arbitrary levels
Adapts to market volatility via ATR
Filters out weak, single-touch levels
Works across all markets and timeframes
This indicator is designed to highlight areas of interest, not generate buy or sell signals.
It is best used in combination with trend, momentum, or volume-based tools.

able FRVP Reversal# able FRVP Reversal - Complete User Guide
## 📌 Overview
**able FRVP Reversal** is a professional-grade Volume Profile indicator with an integrated reversal detection system. It combines Fixed Range Volume Profile (FRVP) analysis with a confluence-based reversal scoring system to identify high-probability turning points at key volume levels.
---
## ✨ Key Features
| Feature | Description |
|---------|-------------|
| **Session-Based Volume Profile** | Automatically resets at the beginning of each regular trading session |
| **POC (Point of Control)** | Highest volume price level - strongest support/resistance |
| **VAH (Value Area High)** | Upper boundary of the 70% value area - resistance zone |
| **VAL (Value Area Low)** | Lower boundary of the 70% value area - support zone |
| **Confluence Scoring System** | 5-point scoring system for reversal detection |
| **Smart Cooldown** | Prevents signal spam with customizable cooldown period |
| **Real-time Info Table** | Displays all key metrics in a retro-style dashboard |
---
## 🔧 Installation
1. Open TradingView and go to **Pine Editor**
2. Delete any existing code and paste the indicator code
3. Click **"Add to Chart"**
4. Configure settings as needed
---
## ⚙️ Settings Explained
### 📊 Volume Profile Settings
| Setting | Default | Description |
|---------|---------|-------------|
| **Number of Rows** | 50 | Resolution of the volume profile (more rows = finer detail) |
| **Value Area %** | 70 | Percentage of volume to include in Value Area (industry standard: 70%) |
| **Profile Width** | 40 | Visual width of the histogram on chart |
| **Show Histogram** | ✓ | Display volume histogram bars |
| **Show POC/VAH/VAL** | ✓ | Display the three key levels |
| **Show Labels** | ✓ | Display price labels for each level |
| **Extend Lines** | ✓ | Extend levels to the right of current price |
| **Extend Length** | 100 | How far to extend the lines (in bars) |
### 🔄 Reversal Detection Settings
| Setting | Default | Description |
|---------|---------|-------------|
| **Enable Reversal Detection** | ✓ | Turn reversal signals on/off |
| **Min Confluence Score** | 3 | Minimum score required to trigger signal (1-5) |
| **Cooldown Bars** | 10 | Minimum bars between signals to prevent spam |
#### Understanding Min Confluence Score:
- **Score 1-2**: Very sensitive, many signals (not recommended)
- **Score 3**: Balanced - good for most traders ⭐ Recommended
- **Score 4**: Conservative - fewer but higher quality signals
- **Score 5**: Very strict - only strongest reversals
### 🎨 Color Settings
All colors are fully customizable:
- **POC Line**: Default Gold (#FFD700)
- **VAH Line**: Default Coral Red (#FF6B6B)
- **VAL Line**: Default Teal (#4ECDC4)
- **Bullish Reversal**: Default Green (#00E676)
- **Bearish Reversal**: Default Red (#FF5252)
---
## 📖 How to Read the Indicator
### Volume Profile Histogram
```
█████████████ ← High volume = Strong S/R
████████ ← Medium volume
████ ← Low volume = Weak S/R
██
```
- **Darker/Longer bars** = More trading activity at that price
- **Inside Value Area** = Colored based on session direction (Bull/Bear)
- **Outside Value Area** = Muted gray color
### Key Levels
| Level | Color | Meaning |
|-------|-------|---------|
| **POC** | Yellow | Price with highest volume - Strongest magnet |
| **VAH** | Red | Upper resistance - Look for bearish reversals |
| **VAL** | Teal | Lower support - Look for bullish reversals |
---
## 🔄 Reversal Detection System
### How the Scoring System Works
The indicator uses a **5-point confluence scoring system**. Each condition adds 1 point:
#### 🟢 Bullish Reversal Score (at VAL)
| Condition | Points | Description |
|-----------|--------|-------------|
| Price at VAL Zone | +1 | Price is within VAL ± 0.2 ATR |
| Bullish Candle | +1 | Close > Open (green candle) |
| RSI Oversold | +1 | RSI < 35 |
| Rejection Wick | +1 | Lower wick > 1.5× body size |
| Failed Breakdown | +1 | Touched below VAL but closed above |
#### 🔴 Bearish Reversal Score (at VAH)
| Condition | Points | Description |
|-----------|--------|-------------|
| Price at VAH Zone | +1 | Price is within VAH ± 0.2 ATR |
| Bearish Candle | +1 | Close < Open (red candle) |
| RSI Overbought | +1 | RSI > 65 |
| Rejection Wick | +1 | Upper wick > 1.5× body size |
| Failed Breakout | +1 | Touched above VAH but closed below |
### Signal Quality Ratings
| Score | Rating | Meaning |
|-------|--------|---------|
| 5/5 | ★★★ | Excellent - Highest probability |
| 4/5 | ★★ | Good - High probability |
| 3/5 | ★ | Acceptable - Moderate probability |
| <3 | - | No signal triggered |
---
## 📋 Info Table Explained
```
╔═ able-REV ═╗ 15 ████████ SCR
─────────────────────────────────────
ZONE UPPER VA ▒▒▓▓████ ▲
POC 4272.680 ██████·· ▲
VAH 4322.745 ████···· ·
VAL 4264.977 ██████·· ·
═ SCORE ═════════════════════════════
BULL 0/5 ········ ·
BEAR 1/5 ░······· ·
RSI 49 ▒▒▓▓···· ·
◄SIGNAL► WAIT ········ ·
```
| Row | Description |
|-----|-------------|
| **ZONE** | Current price position relative to Value Area |
| **POC/VAH/VAL** | Price levels with distance indicators |
| **BULL Score** | Current bullish confluence score |
| **BEAR Score** | Current bearish confluence score |
| **RSI** | RSI value with OB/OS status |
| **SIGNAL** | Current signal status (BUY/SELL/WAIT) |
### Zone Types
| Zone | Meaning | Bias |
|------|---------|------|
| ABOVE VAH | Price broke above resistance | Bullish (but watch for rejection) |
| ⚠ AT VAH | Price testing resistance | Watch for bearish reversal |
| UPPER VA | Price in upper value area | Slight bullish bias |
| LOWER VA | Price in lower value area | Slight bearish bias |
| ⚠ AT VAL | Price testing support | Watch for bullish reversal |
| BELOW VAL | Price broke below support | Bearish (but watch for rejection) |
---
## 📈 Trading Strategies
### Strategy 1: VAH Rejection (Bearish Reversal)
**Setup:**
1. Price approaches or touches VAH (red dashed line)
2. BEAR score reaches 3+ (or your minimum setting)
3. REV signal appears above the candle
**Entry:**
- Enter SHORT on signal candle close
- Or wait for confirmation candle
**Stop Loss:**
- Above the signal candle high
- Or above VAH + 0.5 ATR
**Take Profit:**
- First target: POC (yellow line)
- Second target: VAL (teal line)
---
### Strategy 2: VAL Bounce (Bullish Reversal)
**Setup:**
1. Price approaches or touches VAL (teal dashed line)
2. BULL score reaches 3+ (or your minimum setting)
3. REV signal appears below the candle
**Entry:**
- Enter LONG on signal candle close
- Or wait for confirmation candle
**Stop Loss:**
- Below the signal candle low
- Or below VAL - 0.5 ATR
**Take Profit:**
- First target: POC (yellow line)
- Second target: VAH (red line)
---
### Strategy 3: POC Bounce
**Setup:**
1. Price pulls back to POC after trending
2. POC acts as support/resistance
3. Watch for reversal candle patterns
**Entry:**
- Long if bullish candle at POC from below
- Short if bearish candle at POC from above
**Stop Loss:**
- Other side of POC ± buffer
---
## ⚠️ Important Notes
### When Signals Work Best
✅ **High Probability Setups:**
- Score 4-5 with clear rejection wick
- RSI confirms (oversold for long, overbought for short)
- First test of VAH/VAL in the session
- Clear trend before reversal
❌ **Low Probability Setups:**
- Score barely meeting minimum (3/5)
- Multiple tests of same level (level weakening)
- Low volume/choppy market
- News events pending
### Risk Management Rules
1. **Never risk more than 1-2% per trade**
2. **Always use stop loss** - place beyond the level
3. **Wait for candle close** - don't enter on wick touches
4. **Respect the cooldown** - avoid overtrading
5. **Consider the trend** - counter-trend reversals are riskier
---
## 🔔 Alerts
The indicator includes built-in alerts:
| Alert | Trigger |
|-------|---------|
| VAL Bullish Reversal | BULL score meets minimum at VAL |
| VAH Bearish Reversal | BEAR score meets minimum at VAH |
### Setting Up Alerts:
1. Right-click on the chart
2. Select "Add Alert"
3. Choose "able FRVP Reversal" as condition
4. Select desired alert type
5. Configure notification method
---
## 💡 Pro Tips
1. **Combine with trend analysis** - Reversals in trend direction are more reliable
2. **Watch for confluence with other S/R** - If VAH/VAL aligns with round numbers, previous highs/lows, or fib levels, the level is stronger
3. **Volume confirmation** - Higher volume on reversal candle = stronger signal
4. **Time of day matters** - Reversals during active trading hours are more reliable
5. **Adjust sensitivity by market** - Volatile assets may need higher Min Confluence Score
6. **Use multiple timeframes** - Check if reversal level aligns with higher timeframe levels
---
## 🔧 Recommended Settings by Trading Style
| Style | Min Confluence | Cooldown | Best For |
|-------|----------------|----------|----------|
| Scalping | 3 | 5-7 | Quick trades, more signals |
| Day Trading | 3-4 | 10-15 | Balanced approach |
| Swing Trading | 4-5 | 20+ | Fewer, higher quality signals |
---
## ❓ Troubleshooting
| Issue | Solution |
|-------|----------|
| No signals appearing | Lower Min Confluence Score or check if market is ranging |
| Too many signals | Increase Min Confluence Score or Cooldown Bars |
| Levels not showing | Enable Show POC/VAH/VAL in settings |
| Histogram too wide/narrow | Adjust Profile Width setting |
---
## 📞 Support
For questions, suggestions, or bug reports, please contact the developer.
---
**Version:** 1.0
**Last Updated:** 2024
**Platform:** TradingView (Pine Script v6)

Volume Profile VisionVolume Profile Vision - Complete Description
Overview
Volume Profile Vision (VPV) is an advanced volume profile indicator that visualizes where trading activity has occurred at different price levels over a specified time period. Unlike traditional volume indicators that show volume over time, this indicator displays volume distribution across price levels, helping traders identify key support/resistance zones, fair value areas, and potential reversal points.
What Makes This Indicator Original
Volume Profile Vision introduces several unique features not found in standard volume profile tools:
Dual-Direction Histogram Display:
Unlike conventional volume profiles that only show bars extending in one direction, VPV displays volume bars extending both left (into historical candles) and right (as a traditional histogram). This bi-directional approach allows traders to see exactly where historical price action intersected with high-volume nodes.
Real-Time Candle Highlighting: The indicator dynamically highlights volume bars that intersect with the current candle's price range, making it immediately obvious which volume levels are currently in play.
Four Professional Color Schemes: Each color scheme uses distinct gradient algorithms and visual encoding systems:
Traffic Light: Uses red (POC), green (VA boundaries), yellow (HVN), with grayscale gradients outside the value area
Aurora Glass: Modern cyan-to-magenta gradient with hot magenta POC highlighting
Obsidian Precision: Professional dark theme with white POC and electric cyan accents
Black Ice: Monochromatic cyan family with graduated intensity
Adaptive Transparency System: Automatically adjusts bar transparency based on position relative to value area, with special handling for each color scheme to maintain visual clarity.
Core Concepts & Calculations
Volume Distribution Analysis
The indicator divides the visible price range into user-defined price levels (default: 80 levels) and calculates the total volume traded at each level by:
Scanning back through the specified lookback period (customizable or visible range)
For each historical bar, determining which price levels the bar's high/low range intersects
Accumulating volume for each intersected price level
Optionally filtering by bullish/bearish volume only
Point of Control (POC)
The POC is the price level with the highest traded volume during the analyzed period. This represents the "fairest" price where most traders agreed on value. The indicator marks this with distinct coloring (red in Traffic Light, magenta in Aurora Glass, white in Obsidian Precision, cyan in Black Ice).
Trading Significance: POC acts as a strong magnet for price - markets tend to return to fair value. When price is away from POC, traders watch for:
Mean reversion opportunities when price is far from POC
Rejection signals when price tests POC from above/below
Breakout confirmation when price breaks through and holds beyond POC
Value Area (VA)
The Value Area encompasses the price range where a specified percentage (default: 68%) of all volume traded. This represents the range of "accepted value" by market participants.
Calculation Method:
Start at the POC (highest volume level)
Expand upward and downward, adding adjacent price levels
Always add the level with higher volume next
Continue until accumulated volume reaches the VA percentage threshold
Value Area High (VAH): Upper boundary of accepted value - acts as resistance
Value Area Low (VAL): Lower boundary of accepted value - acts as support
Trading Significance:
Price spending time inside VA indicates market equilibrium
Breakouts above VAH suggest bullish momentum shift
Breakdowns below VAL suggest bearish momentum shift
Returns to VA boundaries often provide high-probability entry zones
High Volume Nodes (HVN)
Price levels with volume exceeding a threshold percentage (default: 80%) of POC volume. These represent areas of strong agreement and consolidation.
Trading Significance:
HVNs act as strong support/resistance zones
Price tends to consolidate at HVNs before making directional moves
Breaking through an HVN often signals strong momentum
Low Volume Nodes (LVN)
Price levels within the Value Area with volume ≤30% of POC volume. These are zones price moved through quickly with minimal consolidation.
Trading Significance:
LVNs represent areas of rejection - price finds little acceptance
Price tends to move rapidly through LVN zones
Useful for setting stop-losses (below LVN for longs, above for shorts)
Can identify potential gaps or "air pockets" in the market structure
Grayscale POC Detection
A secondary POC detection system identifies the highest volume level outside the Value Area (with a 2-level buffer to avoid confusion). This helps identify significant volume accumulation zones that exist beyond the main value area.
How to Use This Indicator
Setup
Choose Lookback Period:
Enable "Use Visible Range" to analyze only what's on your chart
Or set "Fixed Range Lookback Depth" (default: 200 bars) for consistent analysis
Adjust Profile Resolution:
"Number of Price Levels" (default: 80) - higher = more granular analysis, lower = broader zones
Select Color Scheme:
Traffic Light: Best for clear POC/VA/HVN identification
Aurora Glass: Modern aesthetic for dark charts
Obsidian Precision: Professional trader preference
Black Ice: Minimalist single-color family
Visual Customization
Left Extension: How far back the left-side histogram extends into historical candles (default: 490 bars)
Right Extension: Width of the traditional histogram bars on the right (default: 50 bars)
Right Margin: Space between current price bar and histogram (default: 0 for flush alignment)
Left Profile Gap: Space between left-side histogram and candles (default: 0)
Trading Strategies
Strategy 1: Value Area Mean Reversion
Wait for price to move outside the Value Area (above VAH or below VAL)
Look for rejection signals (wicks, bearish/bullish candles)
Enter trades toward the POC
Take profits as price returns to POC or opposite VA boundary
Strategy 2: Breakout Confirmation
Identify when price is consolidating within the Value Area
Wait for a strong close above VAH (bullish) or below VAL (bearish)
Enter on the breakout or on first pullback to the VA boundary
Target previous HVNs or swing highs/lows outside the VA
Strategy 3: POC Support/Resistance
Watch for price approaching the POC level
If approaching from below, look for bullish reversal patterns at POC (support)
If approaching from above, look for bearish reversal patterns at POC (resistance)
Trade in the direction of the bounce with stops beyond the POC
Strategy 4: LVN Fast Movement Zones
Identify LVN zones within the Value Area (marked with "LVN" label)
When price enters an LVN, expect rapid movement through the zone
Avoid entering trades within LVNs
Use LVNs as confirmation of directional momentum
Alert System
The indicator includes 7 customizable alert conditions:
POC Touch: Alerts when price comes within 0.5 ATR of POC
VAH/VAL Touch: Alerts at Value Area boundaries
VA Breakout: Alerts on breakouts above VAH or below VAL
HVN Touch: Alerts when price contacts High Volume Nodes
LVN Entry: Alerts when entering Low Volume zones
POC Shift: Alerts when POC moves to a new price level
Reading the Profile
Price Labels (shown on the right side):
POC: Point of Control - highest volume price level
VAH: Value Area High - upper boundary of accepted value
VAL: Value Area Low - lower boundary of accepted value
LVN: Low Volume Node - expect fast movement through this zone
Color Intensity Interpretation:
Brighter colors = higher volume concentration
Dimmer colors = lower volume
Abrupt color changes = transition between volume zones
Gaps in the histogram = price levels with no trading activity
Technical Details
Volume Accumulation Logic:
For each bar in lookback period:
For each price level:
If bar's high/low range intersects price level:
Add bar's volume to that price level's total
Gradient Algorithm:
Traffic Light: Dual-range piecewise gradient (0-50% and 50-100% volume intensity)
Aurora Glass: Linear cyan-to-magenta interpolation
Obsidian Precision: Dark blue gradient with cyan highlights
Black Ice: Three-stage cyan intensity progression
Real-Time Updates:
The profile recalculates on every bar, including real-time tick data, ensuring the volume distribution always reflects current market structure.
Best Practices
Timeframe Selection: Use higher timeframes (4H, Daily) for swing trading, lower timeframes (5min, 15min) for day trading
Combine with Price Action: Volume profile shows WHERE, price action shows WHEN
Multiple Timeframe Analysis: Check daily VP for major levels, then drill down to intraday for entries
Volume Type Selection: Use "Bullish" volume in uptrends, "Bearish" in downtrends, or "Both" for complete picture
Adjust VA Percentage: 68% (default) captures one standard deviation; try 70% for tighter or 60% for broader value areas
Performance Notes
Maximum bars back: 5000 (handles deep historical analysis)
Maximum boxes: 500 (handles complex profiles)
Optimized calculation: Only recalculates on last bar for efficiency
Real-time capable: Updates as new ticks arrive

VV Moving Average Convergence Divergence # VMACDv3 - Volume-Weighted MACD with A/D Divergence Detection
## Overview
**VMACDv3** (Volume-Weighted Moving Average Convergence Divergence Version 3) is a momentum indicator that applies volume-weighting to traditional MACD calculations on price, while using the Accumulation/Distribution (A/D) line for divergence detection. This hybrid approach combines volume-weighted price momentum with volume distribution analysis for comprehensive market insight.
## Key Features
- **Volume-Weighted Price MACD**: Traditional MACD calculation on price but weighted by volume for earlier signals
- **A/D Divergence Detection**: Identifies when A/D trend diverges from MACD momentum
- **Volume Strength Filtering**: Distinguishes high-volume confirmations from low-volume noise
- **Color-Coded Histogram**: 4-color system showing momentum direction and volume strength
- **Real-Time Alerts**: Background colors and alert conditions for bullish/bearish divergences
## Difference from ACCDv3
| Aspect | VMACDv3 | ACCDv3 |
|--------|---------|---------|
| **MACD Input** | **Price (Close)** | **A/D Line** |
| **Volume Weighting** | Applied to price | Applied to A/D line |
| **Primary Signal** | Volume-weighted price momentum | Volume distribution momentum |
| **Use Case** | Price momentum with volume confirmation | Volume flow and accumulation/distribution |
| **Sensitivity** | More responsive to price changes | More responsive to volume patterns |
| **Best For** | Trend following, breakouts | Volume analysis, smart money tracking |
**Key Insight**: VMACDv3 shows *where price is going* with volume weight, while ACCDv3 shows *where volume is accumulating/distributing*.
## Components
### 1. Volume-Weighted MACD on Price
Unlike standard MACD that uses simple price EMAs, VMACDv3 weights each price by its corresponding volume:
```
Fast Line = EMA(Price × Volume, 12) / EMA(Volume, 12)
Slow Line = EMA(Price × Volume, 26) / EMA(Volume, 26)
MACD = Fast Line - Slow Line
```
**Benefits of Volume Weighting**:
- High-volume price movements have greater impact
- Filters out low-volume noise and false moves
- Provides earlier trend change signals
- Better reflects institutional activity
### 2. Accumulation/Distribution (A/D) Line
Used for divergence detection, measuring buying/selling pressure:
```
A/D = Σ ((2 × Close - Low - High) / (High - Low)) × Volume
```
- **Rising A/D**: Accumulation (buying pressure)
- **Falling A/D**: Distribution (selling pressure)
- **Doji Handling**: When High = Low, contribution is zero
### 3. Signal Lines
- **MACD Line** (Blue, #2962FF): The fast-slow difference showing momentum
- **Signal Line** (Orange, #FF6D00): EMA or SMA smoothing of MACD
- **Zero Line**: Reference for bullish (above) vs bearish (below) bias
### 4. Histogram Color System
The histogram uses 4 distinct colors based on **direction** and **volume strength**:
| Condition | Color | Meaning |
|-----------|-------|---------|
| Rising + High Volume | **Dark Green** (#1B5E20) | Strong bullish momentum with volume confirmation |
| Rising + Low Volume | **Light Teal** (#26A69A) | Bullish momentum but weak volume (less reliable) |
| Falling + High Volume | **Dark Red** (#B71C1C) | Strong bearish momentum with volume confirmation |
| Falling + Low Volume | **Light Pink** (#FFCDD2) | Bearish momentum but weak volume (less reliable) |
Additional shading:
- **Light Cyan** (#B2DFDB): Positive but not rising (momentum stalling)
- **Bright Red** (#FF5252): Negative and accelerating down
### 5. Divergence Detection
VMACDv3 compares A/D trend against volume-weighted price MACD:
#### Bullish Divergence (Green Background)
- **Condition**: A/D is trending up BUT MACD is negative and trending down
- **Interpretation**: Volume is accumulating while price momentum appears weak
- **Signal**: Smart money accumulation, potential bullish reversal
- **Action**: Look for long entries, especially at support levels
#### Bearish Divergence (Red Background)
- **Condition**: A/D is trending down BUT MACD is positive and trending up
- **Interpretation**: Volume is distributing while price momentum appears strong
- **Signal**: Smart money distribution, potential bearish reversal
- **Action**: Consider exits, avoid new longs, watch for breakdown
## Parameters
| Parameter | Default | Range | Description |
|-----------|---------|-------|-------------|
| **Source** | Close | OHLC/HLC3/etc | Price source for MACD calculation |
| **Fast Length** | 12 | 1-50 | Period for fast EMA (shorter = more sensitive) |
| **Slow Length** | 26 | 1-100 | Period for slow EMA (longer = smoother) |
| **Signal Smoothing** | 9 | 1-50 | Period for signal line (MACD smoothing) |
| **Signal Line MA Type** | EMA | SMA/EMA | Moving average type for signal calculation |
| **Volume MA Length** | 20 | 5-100 | Period for volume average (strength filter) |
## Usage Guide
### Reading the Indicator
1. **MACD Lines (Blue & Orange)**
- **Blue Line (MACD)**: Volume-weighted price momentum
- **Orange Line (Signal)**: Smoothed trend of MACD
- **Crossovers**: Blue crosses above orange = bullish, below = bearish
- **Distance**: Wider gap = stronger momentum
- **Zero Line Position**: Above = bullish bias, below = bearish bias
2. **Histogram Colors**
- **Dark Green (#1B5E20)**: Strong bullish move with high volume - **most reliable buy signal**
- **Light Teal (#26A69A)**: Bullish but low volume - wait for confirmation
- **Dark Red (#B71C1C)**: Strong bearish move with high volume - **most reliable sell signal**
- **Light Pink (#FFCDD2)**: Bearish but low volume - may be temporary dip
3. **Background Divergence Alerts**
- **Green Background**: A/D accumulating while price weak - potential bottom
- **Red Background**: A/D distributing while price strong - potential top
- Most powerful at key support/resistance levels
### Trading Strategies
#### Strategy 1: Volume-Confirmed Trend Following
1. Wait for MACD to cross above zero line
2. Look for **dark green** histogram bars (high volume confirmation)
3. Enter long on second consecutive dark green bar
4. Hold while histogram remains green
5. Exit when histogram turns light green or red appears
6. Set stop below recent swing low
**Example**:
```
Price: 26,400 → 26,450 (rising)
MACD: -50 → +20 (crosses zero)
Histogram: Light teal → Dark green → Dark green
Volume: 50k → 75k → 90k (increasing)
```
#### Strategy 2: Divergence Reversal Trading
1. Identify divergence background (green = bullish, red = bearish)
2. Confirm with price structure (support/resistance, chart patterns)
3. Wait for MACD to cross signal line in divergence direction
4. Enter on first **dark colored** histogram bar after divergence
5. Set stop beyond divergence area
6. Target previous swing high/low
**Example - Bullish Divergence**:
```
Price: Making lower lows (26,350 → 26,300 → 26,250)
A/D: Rising (accumulation)
MACD: Below zero but starting to curve up
Background: Green shading appears
Entry: MACD crosses signal line + dark green bar
Stop: Below 26,230
Target: 26,450 (previous high)
```
#### Strategy 3: Momentum Scalping
1. Trade only in direction of MACD zero line (above = long, below = short)
2. Enter on dark colored bars only
3. Exit on first light colored bar or opposite color
4. Quick in and out (1-5 minute holds)
5. Tight stops (0.2-0.5% depending on instrument)
#### Strategy 4: Histogram Pattern Trading
**V-Bottom Reversal (Bullish)**:
- Red histogram bars start rising (becoming less negative)
- Forms "V" shape at the bottom
- Transitions to light red → light teal → **dark green**
- Entry: First dark green bar
- Signal: Momentum reversal with volume
**Λ-Top Reversal (Bearish)**:
- Green histogram bars start falling (becoming less positive)
- Forms inverted "V" at the top
- Transitions to light green → light pink → **dark red**
- Entry: First dark red bar
- Signal: Momentum exhaustion with volume
### Multi-Timeframe Analysis
**Recommended Approach**:
1. **Higher Timeframe (15m/1h)**: Identify overall trend direction
2. **Trading Timeframe (5m)**: Time entries using VMACDv3 signals
3. **Lower Timeframe (1m)**: Fine-tune entry prices
**Example Setup**:
```
15-minute: MACD above zero (bullish bias)
5-minute: Dark green histogram appears after pullback
1-minute: Enter on break of recent high with volume
```
### Volume Strength Interpretation
The volume filter compares current volume to 20-period average:
- **Volume > Average**: Dark colors (green/red) - high confidence signals
- **Volume < Average**: Light colors (teal/pink) - lower confidence signals
**Trading Rules**:
- ✓ **Aggressive**: Take all dark colored signals
- ✓ **Conservative**: Only take dark colors that follow 2+ light colors of same type
- ✗ **Avoid**: Trading light colored signals during high volatility
- ✗ **Avoid**: Ignoring volume context during news events
## Technical Details
### Volume-Weighted Calculation
```pine
// Volume-weighted fast EMA
fast_ma = ta.ema(src * volume, fast_length) / ta.ema(volume, fast_length)
// Volume-weighted slow EMA
slow_ma = ta.ema(src * volume, slow_length) / ta.ema(volume, slow_length)
// MACD is the difference
macd = fast_ma - slow_ma
// Signal line smoothing
signal = ta.ema(macd, signal_length) // or ta.sma() if SMA selected
// Histogram
hist = macd - signal
```
### Divergence Detection Logic
```pine
// A/D trending up if above its 5-period SMA
ad_trend = ad > ta.sma(ad, 5)
// MACD trending up if above zero
macd_trend = macd > 0
// Divergence when trends oppose each other
divergence = ad_trend != macd_trend
// Specific conditions for alerts
bullish_divergence = ad_trend and not macd_trend and macd < 0
bearish_divergence = not ad_trend and macd_trend and macd > 0
```
### Histogram Coloring Logic
```pine
hist_color = (hist >= 0
? (hist < hist
? (vol_strength ? #1B5E20 : #26A69A) // Rising: dark/light green
: #B2DFDB) // Positive but falling: cyan
: (hist < hist
? (vol_strength ? #B71C1C : #FFCDD2) // Rising (less negative): dark/light red
: #FF5252)) // Falling more: bright red
```
## Alerts
Built-in alert conditions for divergence detection:
### Bullish Divergence Alert
- **Trigger**: A/D trending up, MACD negative and trending down
- **Message**: "Bullish Divergence: A/D trending up but MACD trending down"
- **Use Case**: Potential reversal or continuation after pullback
- **Action**: Look for long entry setups
### Bearish Divergence Alert
- **Trigger**: A/D trending down, MACD positive and trending up
- **Message**: "Bearish Divergence: A/D trending down but MACD trending up"
- **Use Case**: Potential top or trend reversal
- **Action**: Consider exits or short entries
### Setting Up Alerts
1. Click "Create Alert" in TradingView
2. Condition: Select "VMACDv3"
3. Choose alert type: "Bullish Divergence" or "Bearish Divergence"
4. Configure: Email, SMS, webhook, or popup
5. Set frequency: "Once Per Bar Close" recommended
## Comparison Tables
### VMACDv3 vs Standard MACD
| Feature | Standard MACD | VMACDv3 |
|---------|---------------|---------|
| **Price Weighting** | Equal weight all bars | Volume-weighted |
| **Sensitivity** | Fixed | Adaptive to volume |
| **False Signals** | More during low volume | Fewer (volume filter) |
| **Divergence** | Price vs MACD | A/D vs MACD |
| **Volume Analysis** | None | Built-in |
| **Color System** | 2 colors | 4+ colors |
| **Best For** | Simple trend following | Volume-confirmed trading |
### VMACDv3 vs ACCDv3
| Aspect | VMACDv3 | ACCDv3 |
|--------|---------|--------|
| **Focus** | Price momentum | Volume distribution |
| **Reactivity** | Faster to price moves | Faster to volume shifts |
| **Best Markets** | Trending, breakouts | Accumulation/distribution phases |
| **Signal Type** | Where price + volume going | Where smart money positioning |
| **Divergence Meaning** | Volume vs price disagreement | A/D vs momentum disagreement |
| **Use Together?** | ✓ Yes, complementary | ✓ Yes, different perspectives |
## Example Trading Scenarios
### Scenario 1: Strong Bullish Breakout
```
Time: 9:30 AM (market open)
Price: Breaks above 26,400 resistance
MACD: Crosses above zero line
Histogram: Dark green bars (#1B5E20)
Volume: 2x average (150k vs 75k avg)
A/D: Rising (no divergence)
Action: Enter long at 26,405
Stop: 26,380 (below breakout)
Target 1: 26,450 (risk:reward 1:2)
Target 2: 26,500 (risk:reward 1:4)
Result: High probability setup with volume confirmation
```
### Scenario 2: False Breakout (Avoided)
```
Time: 2:30 PM (slow period)
Price: Breaks above 26,400 resistance
MACD: Slightly positive
Histogram: Light teal bars (#26A69A)
Volume: 0.5x average (40k vs 75k avg)
A/D: Flat/declining
Action: Avoid trade
Reason: Low volume, no conviction, potential false breakout
Outcome: Price reverses back below 26,400 within 10 minutes
Saved: Avoided losing trade due to volume filter
```
### Scenario 3: Bullish Divergence Bottom
```
Time: 11:00 AM
Price: Making lower lows (26,350 → 26,300 → 26,280)
MACD: Below zero but curving upward
Histogram: Red bars getting shorter (V-bottom forming)
Background: Green shading (divergence alert)
A/D: Rising despite price falling
Volume: Increasing on down bars
Setup:
1. Divergence appears at 26,280 (green background)
2. Wait for MACD to cross signal line
3. First dark green bar appears at 26,290
4. Enter long: 26,295 (next bar open)
5. Stop: 26,265 (below divergence low)
6. Target: 26,350 (previous swing high)
Result: +55 points (30 point risk, 1.8:1 reward)
Key: Divergence + volume confirmation = high probability reversal
```
### Scenario 4: Bearish Divergence Top
```
Time: 1:45 PM
Price: Making higher highs (26,500 → 26,520 → 26,540)
MACD: Positive but flattening
Histogram: Green bars getting shorter (Λ-top forming)
Background: Red shading (bearish divergence)
A/D: Declining despite rising price
Volume: Decreasing on up bars
Setup:
1. Bearish divergence at 26,540 (red background)
2. MACD crosses below signal line
3. First dark red bar appears at 26,535
4. Enter short: 26,530
5. Stop: 26,555 (above divergence high)
6. Target: 26,475 (support level)
Result: +55 points (25 point risk, 2.2:1 reward)
Key: Distribution while price rising = smart money exiting
```
### Scenario 5: V-Bottom Reversal
```
Downtrend in progress
MACD: Deep below zero (-150)
Histogram: Series of dark red bars
Pattern Development:
Bar 1: Dark red, hist = -80, falling
Bar 2: Dark red, hist = -95, falling
Bar 3: Dark red, hist = -100, falling (extreme)
Bar 4: Light pink, hist = -98, rising!
Bar 5: Light pink, hist = -90, rising
Bar 6: Light teal, hist = -75, rising (crosses to positive momentum)
Bar 7: Dark green, hist = -55, rising + volume
Action: Enter long on Bar 7
Reason: V-bottom confirmed with volume
Stop: Below Bar 3 low
Target: Zero line on histogram (mean reversion)
```
## Best Practices
### Entry Rules
✓ **Wait for dark colors**: High-volume confirmation is key
✓ **Confirm divergences**: Use with price support/resistance
✓ **Trade with zero line**: Long above, short below for best odds
✓ **Multiple timeframes**: Align 1m, 5m, 15m signals
✓ **Watch for patterns**: V-bottoms and Λ-tops are reliable
### Exit Rules
✓ **Partial profits**: Take 50% at first target
✓ **Trail stops**: Use histogram color changes
✓ **Respect signals**: Exit on opposite dark color
✓ **Time stops**: Close positions before major news
✓ **End of day**: Square up before close
### Avoid
✗ **Don't chase light colors**: Low volume = low confidence
✗ **Don't ignore divergence**: Early warning system
✗ **Don't overtrade**: Wait for clear setups
✗ **Don't fight the trend**: Zero line dictates bias
✗ **Don't skip stops**: Always use risk management
## Risk Management
### Position Sizing
- **Dark green/red signals**: 1-2% account risk
- **Light signals**: 0.5% account risk or skip
- **Divergence plays**: 1% account risk (higher uncertainty)
- **Multiple confirmations**: Up to 2% account risk
### Stop Loss Placement
- **Trend trades**: Below/above recent swing (20-30 points typical)
- **Breakout trades**: Below/above breakout level (15-25 points)
- **Divergence trades**: Beyond divergence extreme (25-40 points)
- **Scalp trades**: Tight stops at 10-15 points
### Profit Targets
- **Minimum**: 1.5:1 reward to risk ratio
- **Scalps**: 15-25 points (quick in/out)
- **Swing**: 50-100 points (hold through pullbacks)
- **Runners**: Trail with histogram color changes
## Timeframe Recommendations
| Timeframe | Trading Style | Typical Hold | Advantages | Challenges |
|-----------|---------------|--------------|------------|------------|
| **1-minute** | Scalping | 1-5 minutes | Fast profits, many setups | Noisy, high false signals |
| **5-minute** | Intraday | 15-60 minutes | Balance of speed/clarity | Still requires quick decisions |
| **15-minute** | Swing | 1-4 hours | Clearer trends, less noise | Fewer opportunities |
| **1-hour** | Position | 4-24 hours | Strong signals, less monitoring | Wider stops required |
**Recommendation**: Start with 5-minute for best balance of signal quality and opportunity frequency.
## Combining with Other Indicators
### VMACDv3 + ACCDv3
- **Use**: Confirm volume flow with price momentum
- **Signal**: Both showing dark green = highest conviction long
- **Divergence**: VMACDv3 bullish + ACCDv3 bearish = examine price action
### VMACDv3 + RSI
- **Use**: Overbought/oversold with momentum confirmation
- **Signal**: RSI < 30 + dark green VMACD = strong reversal
- **Caution**: RSI > 70 + light green VMACD = potential false breakout
### VMACDv3 + Elder Impulse
- **Use**: Bar coloring + histogram confirmation
- **Signal**: Green Elder bars + dark green VMACD = aligned momentum
- **Exit**: Blue Elder bars + light colors = momentum stalling
## Limitations
- **Requires volume data**: Will not work on instruments without volume feed
- **Lagging indicator**: MACD inherently follows price (2-3 bar delay)
- **Consolidation noise**: Generates false signals in tight ranges
- **Gap handling**: Large gaps can distort volume-weighted values
- **Not standalone**: Should combine with price action and support/resistance
## Troubleshooting
**Problem**: Too many light colored signals
**Solution**: Increase Volume MA Length to 30-40 for stricter filtering
**Problem**: Missing entries due to waiting for dark colors
**Solution**: Lower Volume MA Length to 10-15 for more signals (accept lower quality)
**Problem**: Divergences not appearing
**Solution**: Verify volume data available; check if A/D line is calculating
**Problem**: Histogram colors not changing
**Solution**: Ensure real-time data feed; refresh indicator
## Version History
- **v3**: Removed traditional MACD, using volume-weighted MACD on price with A/D divergence
- **v2**: Added A/D divergence detection, volume strength filtering, enhanced histogram colors
- **v1**: Basic volume-weighted MACD on price
## Related Indicators
**Companion Tools**:
- **ACCDv3**: Volume-weighted MACD on A/D line (distribution focus)
- **RSIv2**: RSI with A/D divergence detection
- **DMI**: Directional Movement Index with A/D divergence
- **Elder Impulse**: Bar coloring system using volume-weighted MACD
**Use Together**: VMACDv3 (momentum) + ACCDv3 (distribution) + Elder Impulse (bar colors) = complete volume-based trading system
---
*This indicator is for educational purposes. Past performance does not guarantee future results. Always practice proper risk management and never risk more than you can afford to lose.*

Hash Pivot DetectorHash Pivot Detector
Professional Support & Resistance Detection with Multi-Timeframe Zone Analysis
Developed by Hash Capital Research, the Hash Pivot Detector is a sophisticated indicator designed for identifying key support and resistance levels using pivot-based detection with institutional-grade zone analysis.
Key Features
Zone-Based Detection
Unlike traditional single-line S/R indicators, Hash Pivot Detector uses configurable zones around pivot levels to represent realistic institutional order areas. Adjustable zone width accommodates different asset volatilities.
Multi-Timeframe Analysis
Displays higher timeframe support/resistance levels alongside current timeframe pivots, providing crucial context for institutional positioning and stronger price barriers.
Clean Visual Design
Features Hash Capital's signature fluorescent color scheme (pink resistance, cyan support) optimized for dark charts with high contrast and instant visual recognition. Semi-transparent zones keep your chart clean and readable.
How It Works
The indicator uses pivot high/low detection with configurable left and right bar parameters. When a pivot is confirmed, it plots:
Primary support/resistance lines at pivot levels
Semi-transparent zones representing realistic order areas
Higher timeframe S/R levels as crosses for additional context
Recommended Settings
For Swing Trading:
Pivot Bars: 10-20 left/right
Zone Width: 0.5-1.0%
HTF: Daily (on 1H-4H charts)
For Intraday Trading:
Pivot Bars: 5-10 left/right
Zone Width: 0.3-0.5%
HTF: 1H or 4H (on 5min-15min charts)
Asset-Specific Zone Width:
Forex/Crypto: 0.3-0.5%
Stocks: 0.5-1.0%
Volatile Assets: 1.0-2.0%
What Makes It Different
✓ Zone-based approach (more realistic than lines)
✓ Multi-timeframe confluence detection
✓ Minimal visual clutter with maximum information
✓ Professional institutional aesthetic
✓ Comprehensive tooltips for easy optimization
✓ No repainting - all pivots are confirmed
Best Used For
Identifying high-probability entry/exit zones
Setting stop-loss and take-profit levels
Recognizing breakout/breakdown areas
Multi-timeframe confluence analysis
Swing trading and position trading
Intraday scalping with adjusted parameters
Notes
Works on all timeframes and markets
Fully customizable colors and parameters
All settings include detailed optimization guidance
Clean code, efficient performance
No alerts or notifications (visual analysis only)
